

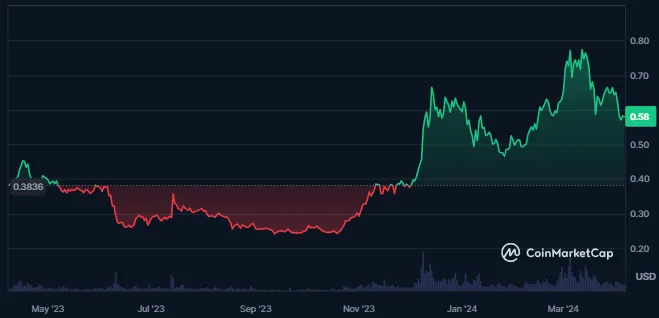
- ADA crypto price has increased by 52% in the last 1 year.
- The market cap of the Cardano is trading flat over the last 24 hours.
Cardano is a Proof-of-Stake blockchain with smart contract capabilities, offering flexibility and scalability. Founded by Charles Hoskinson and Jeremy Wood, it employs the Ouroboros consensus mechanism.
ADA facilitates transactions, governance, and staking rewards. It’s maintained by three entities and progresses through development eras, with ADA holders gaining voting rights.


The market cap of the Cardano crypto is trading flat and has witnessed a slight advance of 0.71% in the last 24 hours. Despite this, the trading volume of the crypto witnessed a 12% decline to $424.267 Million.
The market cap value of the Cardano crypto is $20.642 Billion which makes it the 9th largest cryptocurrency in the world. Also, the volume/market cap ratio of the crypto is 2.06% which shows medium liquidity in the crypto price.
The circulating supply of the crypto is 35.597 Billion ADA which is 79% of the maximum supply of the crypto. Also, the total supply of the crypto is 36.771 Billion ADA and the maximum supply of the crypto is 45.0 Billion ADA. Also, the fully diluted market cap of the crypto is $26.094 Billion. The supply inflation of the crypto is also high resulting in 5.25%
The volatility of the Cardano is high resulting in 8.05% and the market cap dominance of the crypto is 0.82%. Also, the sentiment of the crypto is bearish and the fear and greed index index for the crypto is showing greed among the investors.
Cardano Crypto Derivatives Analysis
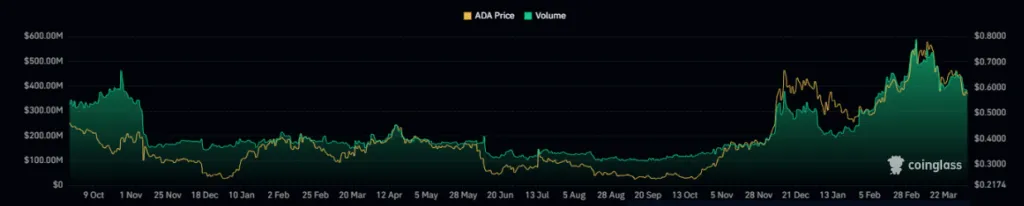
The derivatives trading volume of the crypto has witnessed a huge surge in the last few days. Despite this, the derivatives trading volume for the crypto has witnessed a decline of 14.3% in the last 24 hours. This further results in a traded value of $427.14 Million.
Furthermore, a higher long liquidation for the Cardano is recorded in the last 24 hours which values $254.1K. Also, the short liquidation for the crypto is worth $49.7K which shows sellers dominance.
Cardano Crypto Technical Analysis
The ADA crypto price had broken above the crucial resistance of $0.6900 which was followed by the formation of the higher high swing levels. The price of the crypto further failed to sustain the higher levels and has started to decline by declining below the breakout zone.
The price of the ADA crypto if further wants to continue the uptrend, it will need to break above the most recent swing highs.
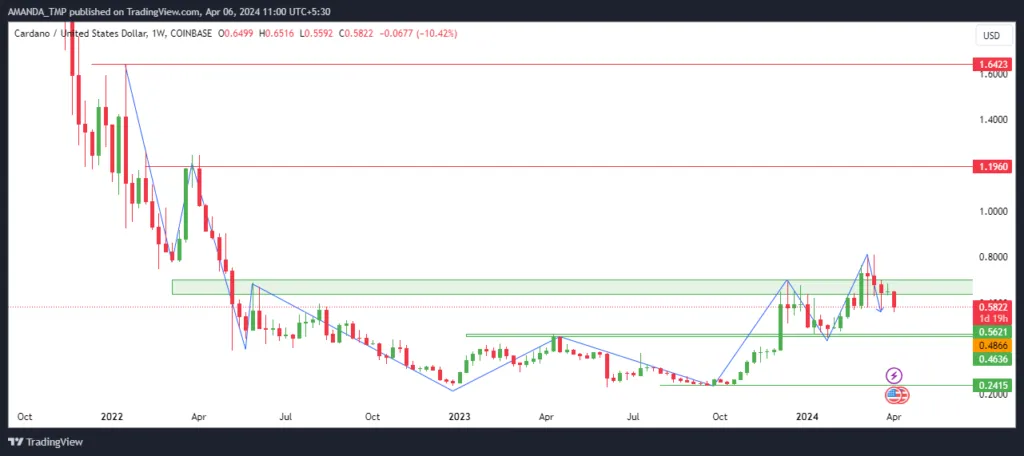
ADA/USD Chart by TradingView
The 50-day and the 200-day EMAs are trading in a golden cross while the price of the ADA crypto has declined below the 20-day and the 50-day EMAs followed by a bearish cross on the daily chart.
The current behavior of the price further indicates that the price of the crypto might continue to decline to 200-day EMA.
The MACD indicator further on the daily chart represents a weakness in the trading price of the crypto. This is followed by the MACD and the signal line trading below the zero level followed by a bearish cross of the metrics.
The RSI has declined below the 50-level from the overbought zones followed by the decline below the 14-day SMA. This further indicates a weakening momentum in the price of the crypto.
Summary
Cardano faces price weakness as it fails to sustain breakout levels, despite a 52% increase in the last year. Market cap remains flat with slight gains, yet trading volume declined 12%. High supply inflation and volatility persist. Technical analysis suggests a potential further decline, with bearish signals from EMAs, MACD, and RSI.
Technical Levels:
- Support levels: $0.2400 and $0.4400
- Resistance levels: $1.1900 and $1.6400
Disclaimer
This article is for informational purposes only and does not provide any financial, investment, or other advice. The author or any people mentioned in this article are not responsible for any financial loss that may occur from investing in or trading. Please do your research before making any financial decisions.


