

- OMI crypto price has shown only 10 green days in the last 30 days.
- Less than 32% of ECOMI crypto is in circulation.
Ecomi offers digital collectibles through its VeVe app, with OMI tokens as in-app utility currency. Co-founded by David Yu, Ecomi aims to revolutionize digital ownership. OMI serves various functions, boosting MCP points, granting exclusive perks, and facilitating transactions in NFT marketplaces and Play-to-Earn games. Initially on GoChain, OMI transitioned to ERC20 on Ethereum.
The market cap of the ECOMI crypto has been trading flat over the last 24 hours resulting in a market cap value of $188.88 Million. The trading volume of the crypto has further advanced by 14.5% which further results in a traded value of $508.2K.


Also, the volume/market cap ratio of the crypto is 0.26% and the self-reporting circulating supply of the crypto is 264.38B OMI. This is further followed by a total supply of 312.33B OMI and the fully diluted market cap of the crypto is $227.75 Million.
The market cap dominance of the Ecomi crypto is 0.01% and its volatility is very high resulting in 13.45%. Also, the sentiment of the crypto is neutral following which the fear and greed index of the crypto is at 76 indicating extreme greed.
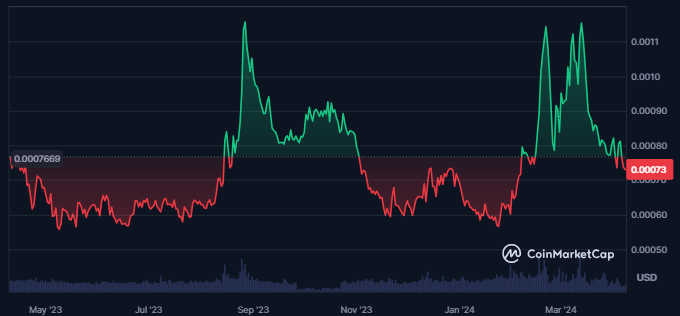
The all-time low price for the OMI crypto is $0.0005262 which was achieved on May 09, 2023. The price of the crypto further has advanced by 35% since its all-time low price. Furthermore, the crypto has lost its value by 76% from its all-time high price of $0.0007416.
Negative Sentiment Vs Positive Sentiment Vs Weighted Sentiment
The negative sentiment and the positive sentiment of the crypto are static and relatively very low. This further results in a very low-weighted sentiment which indicates a lack of social media presence in the crypto.
OMI Crypto Technical Analysis

The OMI crypto price has declined below a dynamic trendline and is currently forming a lower low-swing pattern on the charts. The price of the crypto has formed a double top at the higher levels and the price of the crypto has declined by 45% from the swing high of $0.00133948.
OMI/USD Chart by TradingView.com
The price of the OMI crypto has declined below the crucial EMAs and the 20-day and the 50-day EMAs are trading in a death cross. Also, the price has declined below the 200-day EMA and the 50-day EMA is declining towards the 200-day EMA.
The MACD and the signal line are trading in a bearish cross and have declined below the zero level. This is further followed by bearish histograms formed on the daily timeframe.
The RSI is also consistently declining from the overbought zones and has slipped to the level of 39.29. It also has declined below the 14-day SMA which indicates weakness in the price of the crypto.
Summary
The OMI crypto’s price has formed a double-top pattern, declining by 45% from its swing high. With negative sentiment and declining social media presence, it faces bearish indicators including a death cross in EMAs, MACD bearish crossover, with the RSI slipping below overbought zones, suggesting potential for further deterioration.
Technical Levels:
- Support Levels: $0.000540 and $0.000590
- Resistance Levels: $0.0008560 and $0.001150
Disclaimer
This article is for informational purposes only and does not provide any financial, investment, or other advice. The author or any people mentioned in this article are not responsible for any financial loss that may occur from investing in or trading. Please do your research before making any financial decisions.


