

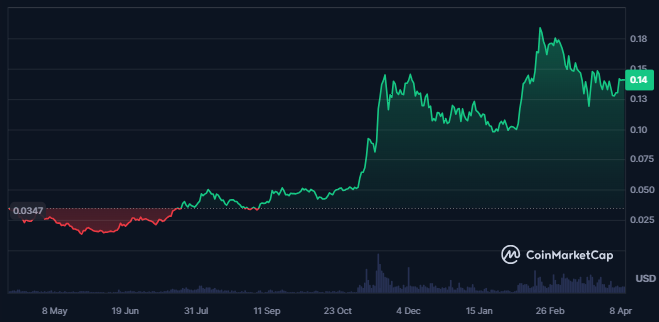
- KAS trading price has advanced by 329% in the last 1 year.
- The price of the crypto outperformed 81% of the top 100 crypto assets in one year.
Kaspa is a proof-of-work cryptocurrency utilizing the GHOSTDAG protocol, forming a blockDAG for instant transaction confirmation. It offers high block rates, privacy, and scalability without compromising security or decentralization. Created by Yonatan Sompolinsky, it began with no pre-mining, ensuring fairness.
The annual inflation rate of the crypto is very high resulting in 31.66% which further results in a circulating supply of 23.28B KAS. Also, the total supply of the crypto is 23.281B KAS and the maximum supply of the crypto is 28.7B KAS.


The market cap of the Kaspa crypto has witnessed a decline of 2.8% in the last 24 hours. It is the 42nd largest cryptocurrency in the global cryptocurrency market with a market cap value of $3.27 Billion.
The traded volume for the crypto has advanced by 5.5% in the last 24 hours resulting in a traded value of $43.592 Million. Also, the fully diluted market cap of the crypto is $4.035 Billion and the market cap dominance of the crypto is 0.12%.
The price of the KAS crypto is highly volatile resulting in a volatility of 5.5%. Also, the sentiment of the crypto is bullish and the fear and greed index of the crypto is showing extreme greed among the investors.
Kaspa Crypto Derivatives Analysis
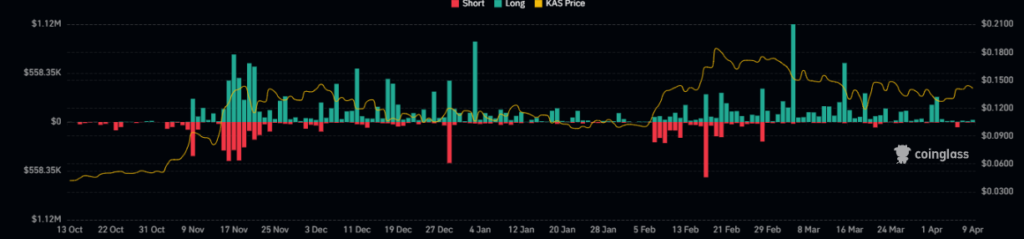
In the last 24 hours, the recorded long liquidation for the crypto is much higher as compared to the short liquidation of the crypto resulting in $30.95K. Also, the short liquidation for the crypto is $6.63K.
The token price further is trading with a long/short ratio of 0.9425 and the derivatives traded volume for the crypto has witnessed an advance of 27% in the last 24 hours. The value of the traded volume for the crypto is $37.58 Million.
KAS Crypto Technical Analysis
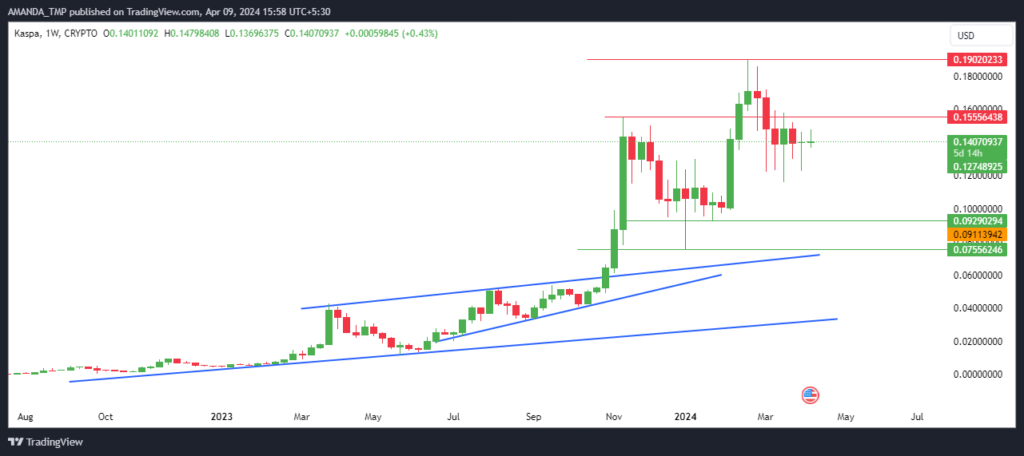
The price of the KAS token has been consistently forming higher highs on the charts and has led to certain highs. The price of the token is currently trading at a level of $0.14097736, at the time of writing and is silently trading inside a small zone.
As soon as the price breaks above the consolidation zone, a further rising momentum in the price of the crypto might be seen.
KAS/USD Chart by TradingView
The 50-day and the 200-day EMAs are trading in a golden cross and the price of the crypto is currently taking support at the 50-day EMA on the daily chart of the KAS crypto price.
The MACD and the signal line has also given a bullish cross but are currently trading below the zero level. If the following further breaks above the zero level, a further surge in the price of the crypto might be seen.
The RSI has also recently broken above the 50 level and is currently sustaining above the same followed by a breakout above the 14-day SMA. The RSI further is also following a bullish cycle as per the conservative RSI trading method.
Summary
Kaspa crypto has given an impressive 329% growth in the past year, outperforming 81% of top cryptos. With its high block rates, privacy features, and bullish sentiment, strategic action involves monitoring its bullish technical indicators like golden cross EMAs, MACD bullish cross, and RSI breakout for potential price surges.
Technical Levels:
- Support Levels: $0.075560 and $0.0929
- Resistance Levels: $0.1555 and $0.1902
Disclaimer
This article is for informational purposes only and does not provide any financial, investment, or other advice. The author or any people mentioned in this article are not responsible for any financial loss that may occur from investing in or trading. Please do your research before making any financial decisions.


