

- BAN crypto price has shown only 13 green days in the last 30 days.
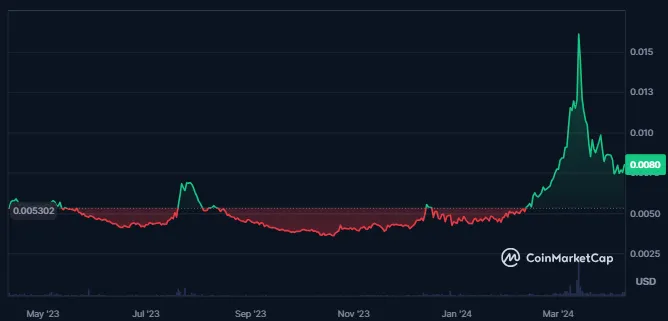
- Banano crypto price is trading 3929% above its all-time low price.
Banano, a feeless, and instant cryptocurrency, utilizes DAG technology to disrupt the meme economy. Stemming from a Nano hard fork, its team, formerly associated with Nano, emphasizes community engagement through daily airdrops, faucets, and memes. With a playful approach and educational focus, Banano aims to onboard crypto newcomers in a fun environment.
Banano crypto prices are highly volatile, resulting in 21.38%, and the supply inflation of crypto is also high. The market cap dominance of the crypto is 0.00%, and the sentiment of the crypto is bullish.


The crypto market cap has advanced by 1.5% in the last 24 hours, resulting in a market cap value of $12.449M. Also, the crypto market cap ranking is #1065, as per CoinMarketCap.
The trading volume for crypto has advanced by 41% in the last 24 hours, and the crypto traded is $51.97K. This results in low liquidity based on its market cap.
The maximum supply of the Banano is not defined, while the circulating supply of the crypto is 1.564B BAN, and the total supply of the crypto is 1.918B BAN. This further results in a fully diluted market cap of $15.304M. Also, the crypto has a liquidity of $165K per DefiLlama, while its TVL is nil.
BAN Crypto Technical Analysis
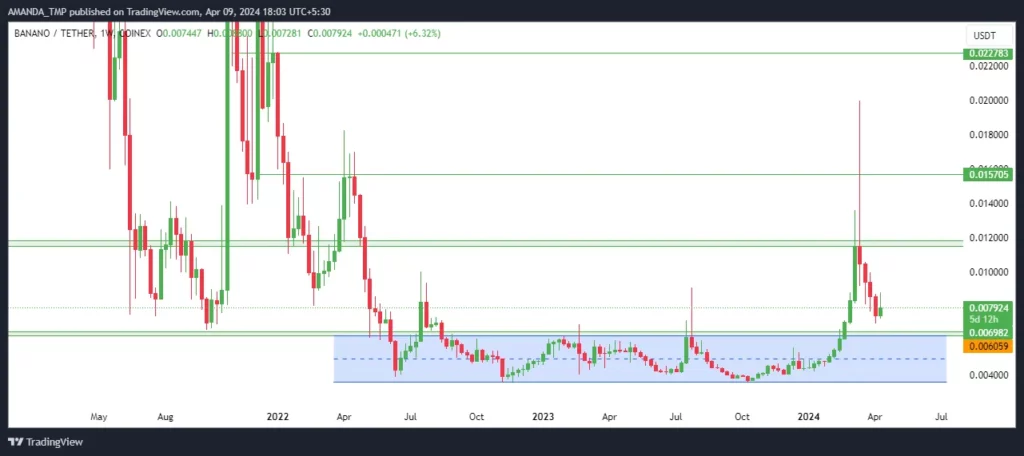
The crypto price consistently traded inside the consolidation zone for a long time, and further, the price broke out above the zone. This breakout led to an advance of 190% in the trading price of the crypto.
The price further failed to sustain the higher levels and has declined back to the breakout levels. If the cost of the BAN crypto again gains momentum and sustains above the level of $0.012114, a further surge in the price of the crypto might be seen.
BAN/USDT Chart by TradingView
The price of the crypto has declined below 20-day and 50-day, and the EMAs overlap each other. The cost of the crypto further declines towards the 200-day EMA.
The MACD indicator indicates bearishness in the crypto price as the MACD and the signal line are trading below the zero level following a bearish crossover.
The RSI of the crypto further has declined below the 50 level and is currently trading at a level of 45.11. It has also declined below the 14-day SMA. The following behavior of the indicator on the daily chart indicates weakness in the trading price of the crypto.
Summary
Banano’s price, amidst high volatility, recently surged 190% after breaking out from a consolidation zone but failed to sustain higher levels, retracing back to breakout levels. Technical analysis shows bearish signs with declining RSI, MACD below zero, and overlapping EMAs, suggesting a potential downside if it fails to maintain the $0.012114 level.
Technical Levels:
- Support levels: $0.003590 and $0.0070
- Resistance levels: $0.01570 and $0.02270
Disclaimer
This article is for informational purposes only and provides no financial, investment, or other advice. The author or any people mentioned in this article are not responsible for any financial loss that may occur from investing in or trading. Please do your research before making any financial decisions.


