

- The price of the Brett crypto is considered highly volatile.
- The crypto has medium liquidity based on its market cap.
Brett crypto, or BRETT token, is a cryptocurrency priced around $0.08. It’s seen a rollercoaster ride lately, surging over 200% in a week but also experiencing dips. With a market cap of over $660 million, it ranks around #215 among all cryptocurrencies.
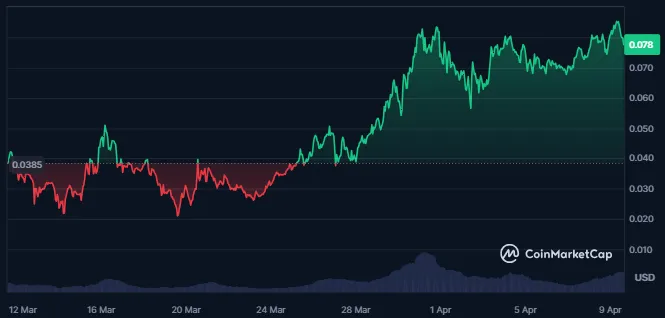
Brett crypto’s market cap has witnessed a decline of 2.68% in the last 24 hours, while the crypto price has advanced by 100% in the previous year.


The value of the crypto traded volume has advanced by 38% in the last 24 hours. This further results in a traded value of %32.878M, which is 4.99% of the crypto market cap.
The current volatility of the crypto is 37.74%, and the market cap dominance of the crypto is 0.03%. Furthermore, the fear and greed index of the crypto is at 80, which indicates extreme greed. It is based on the Base Chain Platform and is built on the Solana blockchain. It further uses SPL token standards.
The circulating supply of crypto is 8.554B BRETT, which is 85.55% of the maximum crypto supply. Also, the total supply of the crypto is 9.99B BRETT, and the maximum supply is 10.0B BRETT. This further results in a fully diluted market cap of $773.72M.
Social Dominance Vs Social Volume
The social volume of the crypto has subsequently declined, as per Santiment.net, and the social volume of the crypto has decreased over time. This shows that the popularity of the crypto is shallow.
BRETT Crypto Technical Analysis
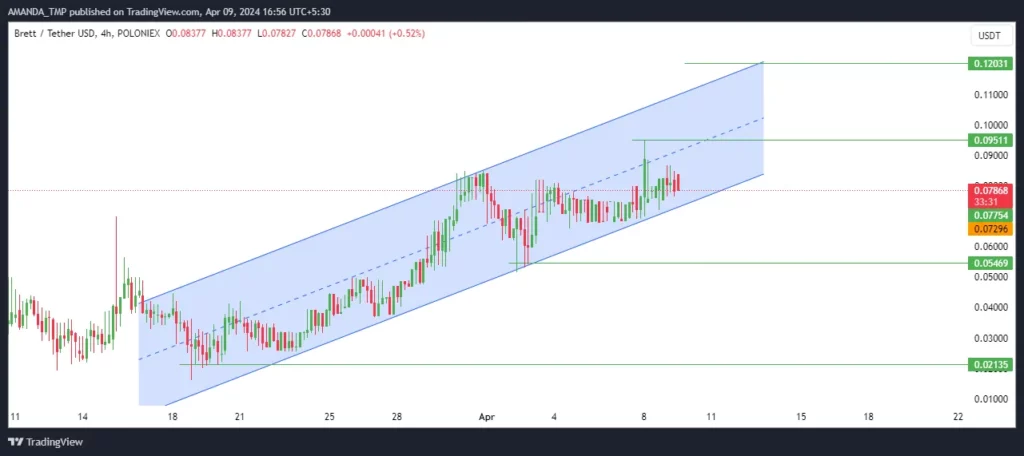
The BRETT crypto price consistently rises to higher levels, followed by the formation of a higher high swing on the crypto 4H chart. The cost of the crypto trading inside a rising wedge pattern further follows this.
The crypto price exhibits a bullish behavior, and if the price is further sustained inside the rising wedge pattern, a surge in the crypto price might be seen.
BRETT/USD Chart by TradingView
The 20-day and the 50-day EMA on the 4H chart of the crypto is consistently advancing to a higher level with a bullish cross. An advance has followed this in the crypto price since its release.
The MACD and the signal line overlap, but both metrics trade above the zero level. This indicates a bullish trend in the overall price of the crypto.
The RSI is trading above the 50-level and is sustaining above the same. This is further followed by the RSI, which follows a bullish cycle.
Summary
With Brett crypto forming higher high swings and trading within a rising wedge pattern, bullish momentum is evident. Technical indicators like bullish EMA crosses, MACD above zero, and RSI sustaining above 50 support further price surges. Market cap growth, increased trading volume, and extreme greed sentiment reinforce bullish prospects.
Technical Levels:
- Support levels: $0.02100 and $0.0540
- Resistance levels: $0.0950 and $0.1200
Disclaimer
This article is for informational purposes only and provides no financial, investment, or other advice. The author or any people mentioned in this article are not responsible for any financial loss that may occur from investing in or trading. Please do your research before making any financial decisions.


