
- Shiba Inu crypto has liquidity when compared to its market cap.
- SHIB is the 12th largest cryptocurrency in the global cryptocurrency market.
Shiba Inu (SHIB), a meme-inspired cryptocurrency launched in August 2020 by an anonymous individual or group called Ryoshi, operates as a community-driven project. Built on Ethereum, it features a quadrillion initial supply, with tokens burned over time. Its ecosystem includes SHIB, Leash, Bone tokens, and various applications like ShibaSwap and NFTs.
The market cap of the Shiba Inu crypto has witnessed a decline of 3.5% in the last 24 hours. This further values $15.964B. Following this, the traded volume of the crypto has also seen a drop of 15.5%.


The value of the traded volume for the crypto over the last 24 hours is $540.905M, resulting in a volume/market cap ratio of 3.28%. Also, the market cap dominance of the crypto is 0.62%, and there is meager supply inflation.
The Onchain market cap of the Shiba Inu is $27.469B, and the circulating supply market cap is worth $16.179B. The total and circulating supply of the crypto are the same, resulting in 589.28T SHIB.
The crypto sentiment is bearish, as per Coincodex, followed by a high volatility of 7.23% in the trading price. Furthermore, the fear and greed index indicates extreme greed among investors.
Shiba Inu Derivatives Analysis
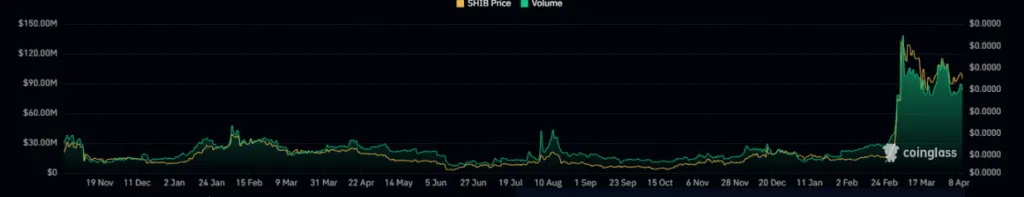
The derivatives trading volume of the Shiba Inu token has consistently advanced from its average volume. It is trading at its significant highs while declining by 19.7% in the last 24 hours.
This further results in a value of $170.95M for derivatives traded volume. The open interest in crypto has witnessed a decline of 5.1%, and the long/short ratio for crypto is 0.9885.
The long liquidation for the crypto is also too high compared to the short liquidation in the last 24 hours. Moreover, the long liquidation for the crypto is $749.72K, and the short liquidation for the crypto is just $74.76K.
SHIB Crypto Technical Analysis
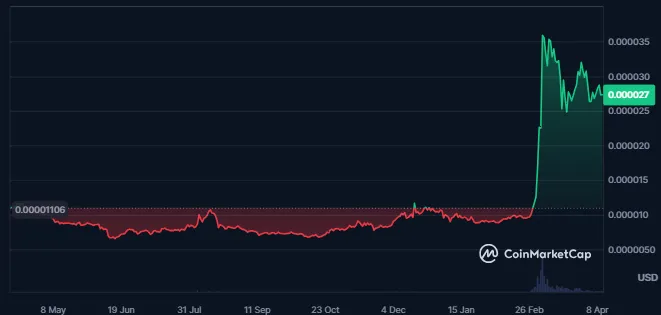
The price of the SHIB crypto was trading inside a falling wedge pattern for a long time, and then the price broke out above the pattern, leading to a surge of 280% in the cost of crypto since the breakout. Since the price rises, the token’s price is taking a rest and trading in a small range.
If the price declines and retraces to a certain low and forms a bullish price action, the crypto trend might continue.
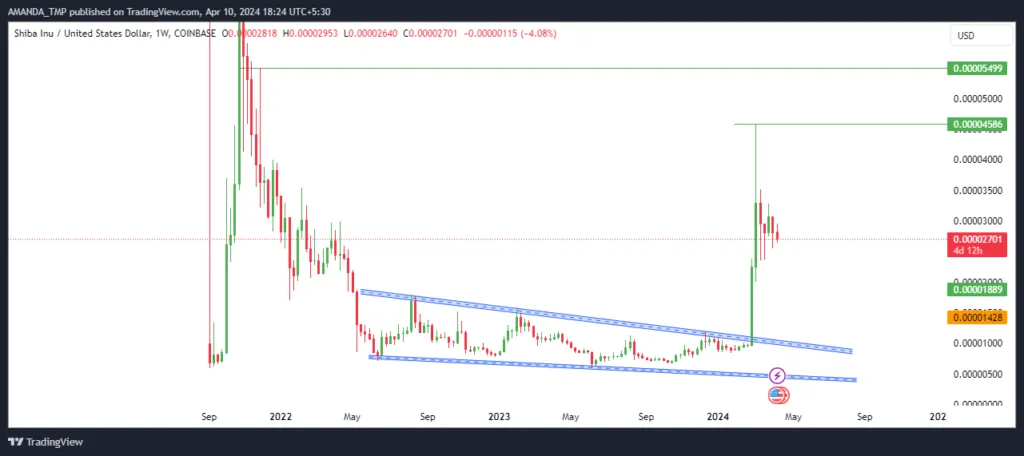
SHIB/USD Chart by TradingView
The price of the SHIB crypto is taking support at the 20-day EMA, and the 20-day and the 50-day EMAs are trading in a bullish cross, followed by the golden cross of the 50-day and the 200-day EMA.
The MACD and the signal line on the daily crypto chart are declining from higher levels, followed by a bearish cross. The histograms also support the declining momentum of price followed by the formation of bearish histograms.
The RSI has also recently slipped below the 50-level and the 14-day SMA from the overbought zones. The RSI is currently trading at a level of 47.62, which represents a weakness in the momentum of the SHIB crypto price.
Summary
Shiba Inu crypto faces uncertain sentiment with declining market cap and trading volume. While it ranks 12th globally, its low supply inflation and Onchain market cap remain stable. Derivatives trading volume surged but declined recently. Technical analysis shows potential bullish continuation if certain levels hold, but indicators signal bearish momentum.
Technical Levels:
- Support levels: $0.00000590 and $0.0000170
- Resistance levels: $0.0000450 and $0.0000540
Disclaimer
This article is for informational purposes only and provides no financial, investment, or other advice. The author or any people mentioned in this article are not responsible for any financial loss that may occur from investing in or trading. Please do your research before making any financial decisions.


