

- The Kin cryptocurrency’s trading volume has risen over the last 24 hours.
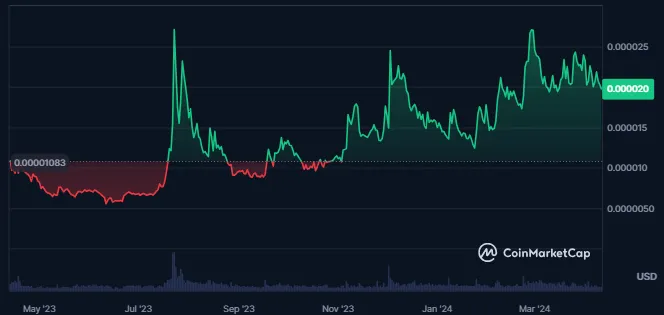
- The price of the Kin crypto has advanced by 93% in the previous year.
Kin, established in 2017 under the Kin Foundation, fosters a digital ecosystem with blockchain designed for mass scalability. KIN cryptocurrency powers micro-transactions within apps, encouraging developers to integrate Kin SDK for incentives through the Kin Rewards Engine. The Stellar Consensus Protocol (SCP) facilitates efficient decentralized decision-making.
The Kin crypto’s trading volume has increased 17.5% in the last 24 hours. The traded value for the crypto is $270K, and the crypto’s volume/market cap ratio is 0.46%.


The cryptocurrency’s market cap has witnessed a slight decline of 1.5% in the last 24 hours, resulting in a market cap value of $57.992M. Also, the crypto’s market cap ranking is #618 as per CoinMarketCap. Its market cap dominance is very low.
The cryptocurrency’s volatility is high, resulting in 5.75%, followed by a high supply inflation of 33.01%. The sentiment of the Kin crypto is neutral, and the fear and greed index is at 76, representing extreme greed.
The crypto has a circulating supply of 2.935T KIN, similar to the total supply and maximum supply. Also, the fully diluted market cap of the crypto is $57.888M.
The crypto’s price has advanced by 735% from its all-time low price. The following price was recorded on January 10, 2020, about 4 years ago. Also, the high price of $0.001493 for the Kin crypto was recorded on January 06, 2018, and the price since then has declined by 98.6%.
Social Dominance Vs Development Activity
The social dominance of crypto has remained the same, meaning its social engagement could have been much higher. Also, the development activity of crypto has not seen significant changes, which shows a lack of updates in the crypto blockchain.
KIN Crypto Technical Analysis
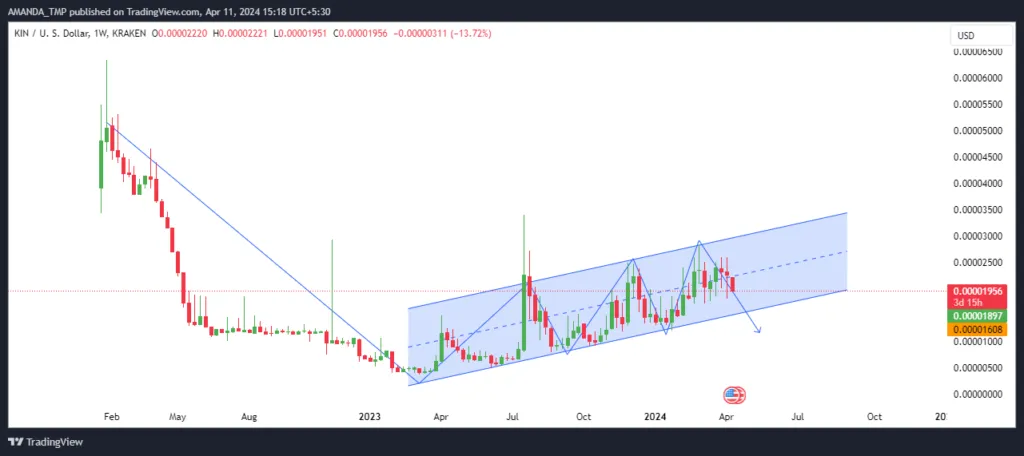
The price of the KIN crypto is trading inside a rising wedge pattern, slowly advancing to higher levels. Furthermore, the overall trend of this crypto is bearish, and the price has come to the current level from much higher levels.
Thus, the probability of a breakdown in the crypto price is high. If the price breaks below the wedge pattern, we might see lower KIN crypto trading price levels.
KIN/USD Chart by TradingView
The EMAs are trading in a golden cross on the daily chart, while the crypto’s price has declined below the 20-day and 50-day EMAs. The price of the crypto further is heading towards the 200-day EMA.
The MACD indicator shows weakness on the charts as the MACD and the signal line have declined below the zero level. These metrics also trade in a bearish cross.
The RSI value has also declined below the 50-level and the 14-day SMA. The following behavior again shows a decline in the momentum of the crypto price.
Summary
The Kin price exhibits a rising wedge pattern, signaling potential downward movement. Despite a slight rise in trading volume and significant year-over-year gains, the technical outlook remains bearish. With low social dominance and development activity, a breakdown below the wedge pattern could lead to further declines in Kin’s price.
Technical Levels:
- Support levels: $0.00000380 and $0.00001120
- Resistance levels: $0.00003390 and $0.00005320
Disclaimer
This article is for informational purposes only and does not provide any financial, investment, or other advice. The author or any people mentioned in this article are not responsible for any financial loss that may occur from investing in or trading. Please do your research before making any financial decisions.


