

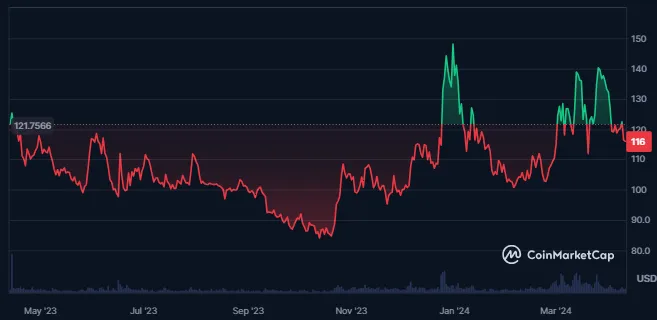
- Quant price has given positive performance compared to its token sale price.
- QNT crypto has advanced by 70785% from its all-time low price.
Quant, founded in 2018, offers Overledger Network, facilitating cross-blockchain connectivity via APIs. Its hybrid consensus, merging PoS and PoA, aims for efficiency.
QNT, its native token, powers the network, enabling governance, fee payment, and MApp development. Co-founded by Gilbert Verdian and Dr. Paolo Tasca, Quant targets decentralized multi-chain application deployment for blockchain interoperability.


The market cap of Quant Crypto has shown a slight change of 0.08% over the last 24 hours. That has resulted in a market cap value of $1.399B, which led to the market cap dominance of 0.05%.
Quant is the 76th largest cryptocurrency in the global cryptocurrency market. The trading volume for the crypto further has witnessed a decline of 8.02%, resulting in a traded value of $20.252M. This results in a volume/market cap ratio of 1.45%.
The trading volume of the crypto derivatives has declined by 6.8% in the last 24 hours, resulting in a traded value of $18.46M. The open interest in the crypto has decreased by 5.7%.
The long/short ratio for the derivatives of the crypto is 0.9372, and the long liquidation for the crypto is $21.47K. Despite this, the short liquidation of the crypto is worth just $5.13K.
The sentiment of the Quant crypto is bearish, as per Coincodex, and the fear and greed index of the crypto is at 76, representing extreme greed. Also, the cryptocurrency’s volatility is high at 6.3%.
Quant Token Supply Overview
The Onchain market cap of the crypto is $5.272B, following which the crypto has a circulating supply of 12.072M QNT, which is 81.13% of the maximum supply. Also, the total and maximum supplies of the crypto is 14.881M QNT, with a circulating supply market cap of $1.687B.
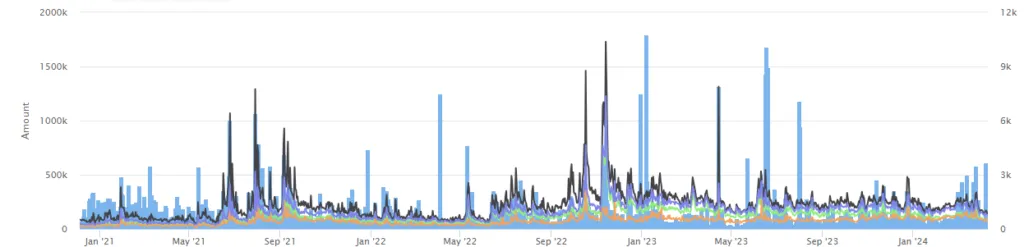
Negative Sentiment Vs Positive Sentiment Vs Weighted Sentiment
The negative sentiment and the bullish sentiment of the crypto have declined to certain lows, following which the weighted sentiment of the crypto has also been very low. Also, there is no significant activity in the social presence of the crypto.
QNT Crypto Technical Analysis
The price of Quant crypto is trading inside a dynamic range and is revolving around a higher and lower dynamic trendline. Further breakout in the price of the crypto in either direction in price will ascertain the further trend of the crypto.
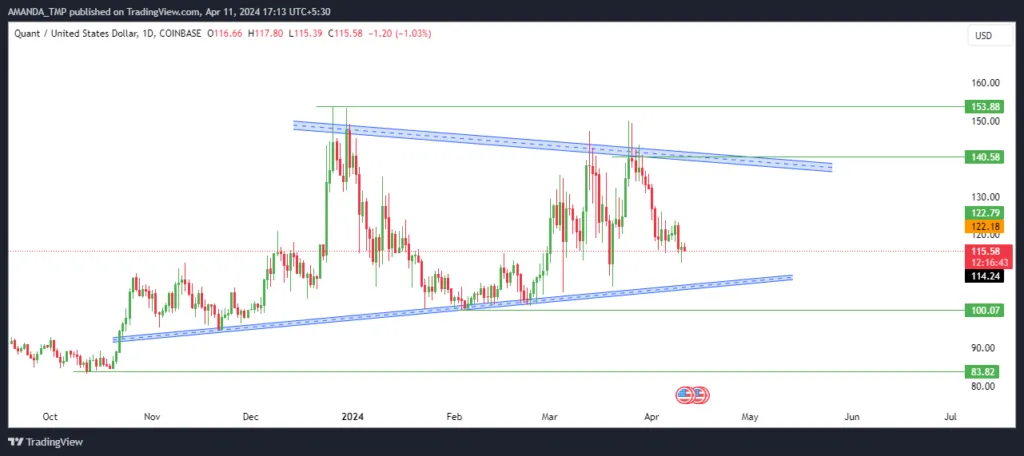
QNT/USD Chart by TradingView
The QNT crypto price is trading below the 20-day and the 50-day EMA and is currently trading at the 200-day EMA. If the cryptocurrency’s price slides further below the 200-EMA, a bearish change in the crypto trend might be seen.
The MACD indicator also shows weakness as the MACD and the signal line have declined below the zero level. The histograms formed on the chart also support the bearishness of the price.
The RSI has declined below the 50 level from the overbought zones on the daily chart. It is currently trading at 40.0 and has dropped below the 14-day SMA.
Summary
Quant’s price struggles to maintain breakout levels, facing bearish sentiment despite significant year-over-year gains. QNT’s technical indicators suggest a potential shift to a bearish trend, with prices hovering near key EMAs. Declining sentiments and lack of significant social activity add uncertainty to Quant’s future price trajectory.
Technical Levels:
- Support levels: $84.00 and $100.00
- Resistance levels: $140.00 and $154.00
Disclaimer
This article is for informational purposes only and does not provide any financial, investment, or other advice. The author or any people mentioned in this article are not responsible for any financial loss that may occur from investing in or trading. Please do your research before making any financial decisions.


