

- The price of the OOE crypto has advanced by 304% in the last year.
- The volume for the OpenOcean has witnessed a surge in the previous 24 hours.
OpenOcean is a comprehensive crypto trading aggregation protocol that bridges liquidity from decentralized and centralized platforms and facilitates cross-chain swaps. Its intelligent routing algorithm optimizes price discovery and minimizes slippage. OOE token serves as governance and utility, empowering users to participate in protocol governance and shape its future direction.

The market cap of crypto has advanced by 0.36% in the last 24 hours, which has resulted in a market cap of $10.519M. Furthermore, the crypto market cap ranking is $1115.


The traded volume for crypto has advanced by 19.1% in the last 24 hours, and the value of the crypto is worth $380K. This further results in a volume/market cap ratio of 3.61%.
OpenOcean crypto further has a circulating supply of 504.425M OOE, 50.4% of the maximum crypto supply. Also, the total and maximum supply of the crypto is the same, resulting in 1.0B OOE. This further results in a fully diluted market cap of $20.848M.
The market cap dominance of the OpenOcean crypto is 0.04%, and the volatility of the crypto is also high, resulting in 11.81%. Furthermore, the supply inflation of the crypto is 12.72%, which is considered very high.
On October 21, 2023, the OpenOcean crypto hit an all-time low price of $0.008109, and the crypto price has advanced by 157% since then. Also, the all-time high price achieved by the crypto is $1.03, and the current trading price of the crypto is $0.02085.
Total Amount Of Holders Vs Social Dominance Of OpenOcean
The social dominance of the OpenOcean crypto is very low, but despite this, the total number of crypto holders has consistently advanced over time. This shows that more investors are participating in the market.
OOE Crypto Technical Analysis
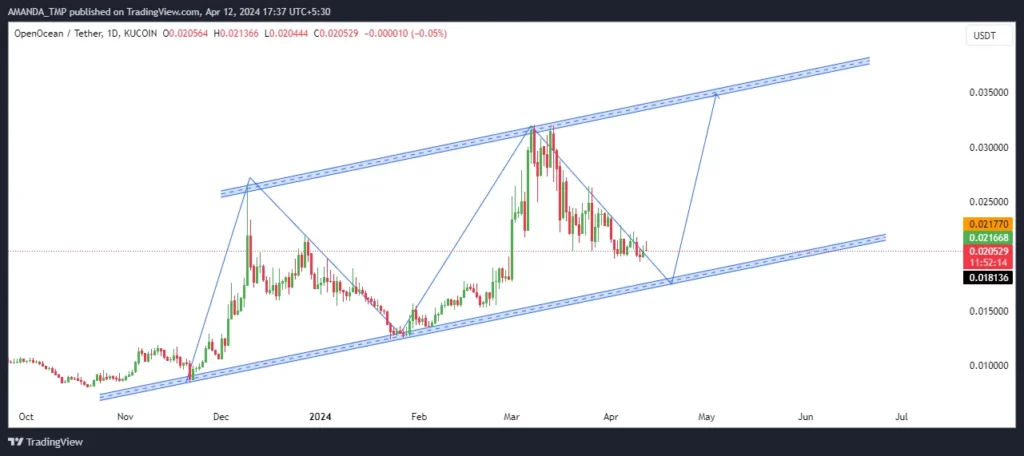
The crypto price trades inside a rising wedge pattern and is slowly advancing to higher levels. Moreover, the cost of the crypto is about to hit the lower band of the rising wedge pattern. Whenever the price hits the lower band of the wedge pattern, it needs to form a bullish candlestick pattern. The expected behavior of the cost might lead the crypto to higher levels.
OOE/USDT Chart by TradingView
The crypto price has declined below the 20-day and the 50-day EMA, but there is a golden cross between the 50-day and the 200-day EMAs on the charts. The overall scenario of the crypto depicts a bullish trend in the price.
The metrics of the MACD indicator, such as the MACD and the signal line, are trading in a bearish cross and have declined below the zero level.
The RSI has also declined below the 50-level and the 14-day SMA. This is leading the price to fall to lower levels.
Summary
The price of OOE crypto has surged by 304% in a year, with recent volume spikes. The market cap rose slightly to $10.519M. Despite high volatility and inflation, it hit an all-time low in 2023. Social dominance is low, but holder numbers are rising. Technical analysis suggests a potential rise within a rising wedge pattern, but indicators are mixed.
Technical Levels:
- Support levels: $0.00870 and $0.01270
- Resistance levels: $0.02640 and $0.03100
Disclaimer
This article is for informational purposes only and provides no financial, investment, or other advice. The author or any people mentioned in this article are not responsible for any financial loss that may occur from investing in or trading. Please do your research before making any financial decisions.


