

- SushiSwap crypto has high liquidity based on its market cap.
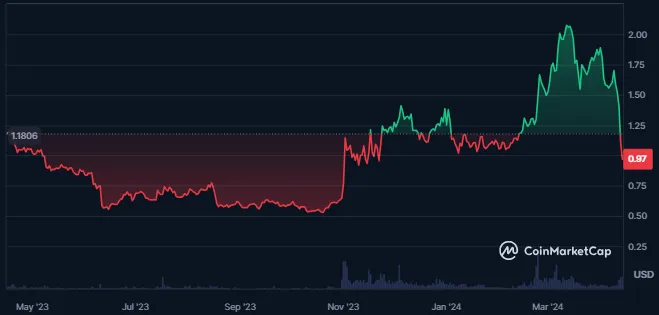
- SHUSI crypto price has gone down by 20% in the past year.
SushiSwap, launched in 2020 by Chef Nomi and later handed over to Sam Bankman-Fried, offers decentralized finance services on Ethereum. Governed by $SUSHI token holders, it incentivizes liquidity provision and governance participation. Users swap tokens via the platform, earning $SUSHI for liquidity provision and staking. Trading fees partly reward $SUSHI holders.
SushiSwap has witnessed a decline of 9.8% in its market cap in the last 24 hours. This resulted in a value of $229.269M, and the traded volume for the crypto further witnessed an increase of 10.5%.


SushiSwap has a market cap ranking of #249, and the value of the crypto-traded volume is $120.01M. This results in a volume/market cap ratio of 52.59%, which makes it easy to buy and sell the crypto.
The circulating supply of the crypto is 236.121M SHUSHI, and the total supply of the crypto is 250.204M SUSHI. Moreover, the maximum supply of crypto has not been disclosed, but the fully diluted market cap of crypto is $243.041M. The supply inflation of the crypto is also very high.
The market cap dominance of the crypto is 0.01%, and the volatility of the crypto is very high, resulting in 10.62%. Also, the sentiment of the crypto is bearish, and the fear and greed index of the crypto is at 72, indicating greed.
SushiSwap Crypto Derivatives Data Analysis
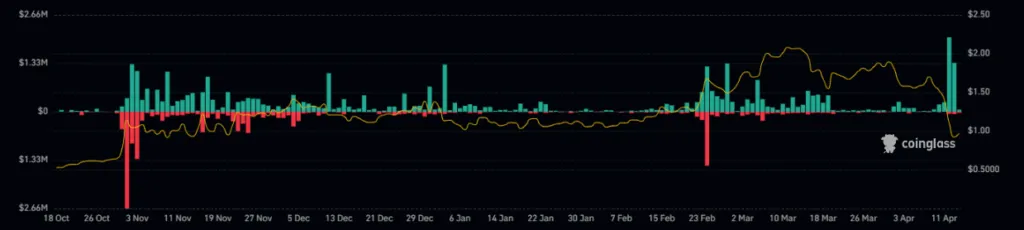
Higher long liquidations can be seen in the data provided by Coinglass. The derivatives volume for the crypto further has advanced by 13.6% in the last 24 hours. This further results in a traded value of $230.05M.
Also, over the last 24 hours, the long liquidation recorded for the crypto is $1.31M, and the short liquidation is just $83.61K. This further results in a long/short ratio of 0.9451.
SUSHI Crypto Technical Analysis
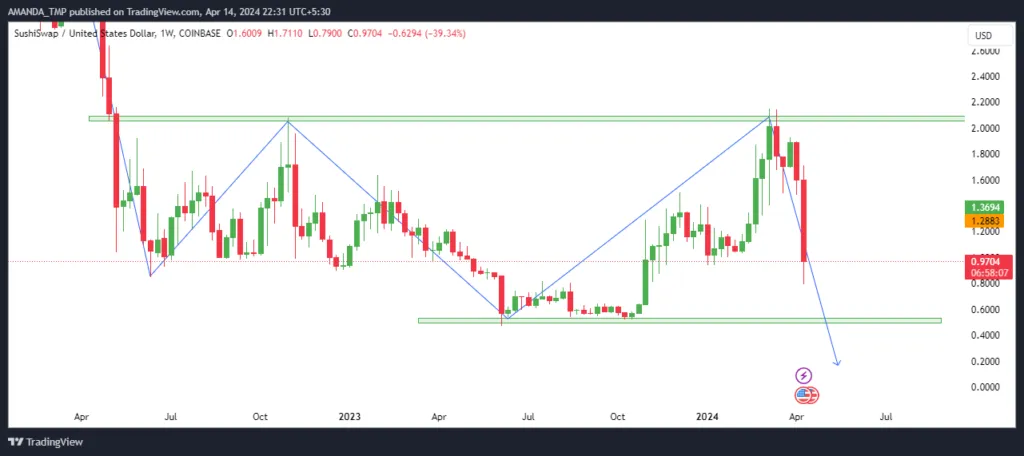
SUSHI crypto price has formed a strong bearish candle on the weekly chart, indicating a solid presence of crypto sellers. If the price of the crypto continues to decline and breaks below the level of $0.50, a further decline in the price of the crypto might be witnessed, followed by a strong bearish trend in the price of the crypto.
SUSHI/USD Chart by TradingView
On the daily chart, the price of the SushiSwap crypto has declined below the 20-day and the 50-day EMA. The price also trades below the 200-day EMA, showing strong pessimism among the traders.
The MACD indicator also indicates weakness on the chart as the MACD and the signal line are trading in a bearish cross. The following metrics have also declined below the zero level, and the MACD line is trading at a level of -0.1625.
The RSI has declined to the oversold zones and is currently trading at a level of 25. It further has declined below the 14-day SMA and is following a bearish cycle on the charts.
Summary
SushiSwap faces bearish pressures as its price forms a strong bearish candle on the weekly chart, signaling seller dominance. Technical indicators like the MACD and RSI show weakness, with prices below key EMAs. Long liquidations outweigh shorts, indicating pessimism. A break below $0.50 could trigger a further decline.
Technical Levels:
- Support levels: $0.20 and $0.50
- Resistance levels: $2.00 and $3.70
Disclaimer
This article is for informational purposes only and provides no financial, investment, or other advice. The author or any people mentioned in this article are not responsible for any financial loss that may occur from investing in or trading. Please do your research before making any financial decisions.


