
- Gala crypto’s price has melted to the 200-day exponential moving average.
- The GALA coin price has been struggling between the 20-day and 200-day EMAs.
- Its trading volume has dropped by 28% in the last 24 hours.
The Gala price has witnessed selling pressure for the last few weeks and has melted to the 200-day exponential moving average. The GALA crypto price has declined by 42% in the previous 7 days. Since November 2023, the Gala crypto price has been bullish and gained 362%. It recorded a 52-week high of $0.0867 on March 10, 2024, but it failed to sustain the high, and profit booking was observed.
According to the chart structure, the price has been facing resistance from a falling trendline, and sellers are dominating. The GALA price has faced resistance from the trendline and declined by approximately 40% in the last few days.


The Gala crypto price is trading at $0.0408, which has lost 2.04% in the last 24 hours. The 24-hour trading volume is $157 million, with a loss of 28%. The market capitalization is $1.25 billion, and the fully diluted market cap is $1.33 billion. The circulating supply is 30,672,232,367 GALA, and the total supply is 32,701,392,503 GALA.
Gala Crypto Social Dominance and Social Volume Analysis
According to the given data, social dominance and social volume have increased over the last few months, and the Gala price has also increased. For the last few days, awareness on social media about Gala crypto has decreased, negatively impacting the price. If social dominance and volume increase, the price may be positively affected.
Gala Crypto Volume vs Price Analysis
In the second week of March, the trading volume was pumped by more than 1000%, leading to a gain of 100% in price. In the last 3 days, the trading volume has dropped by more than 60%, and the price has also dropped.
Gala Price Has Formed a Descending Triangle: Will It Trigger a Breakdown?
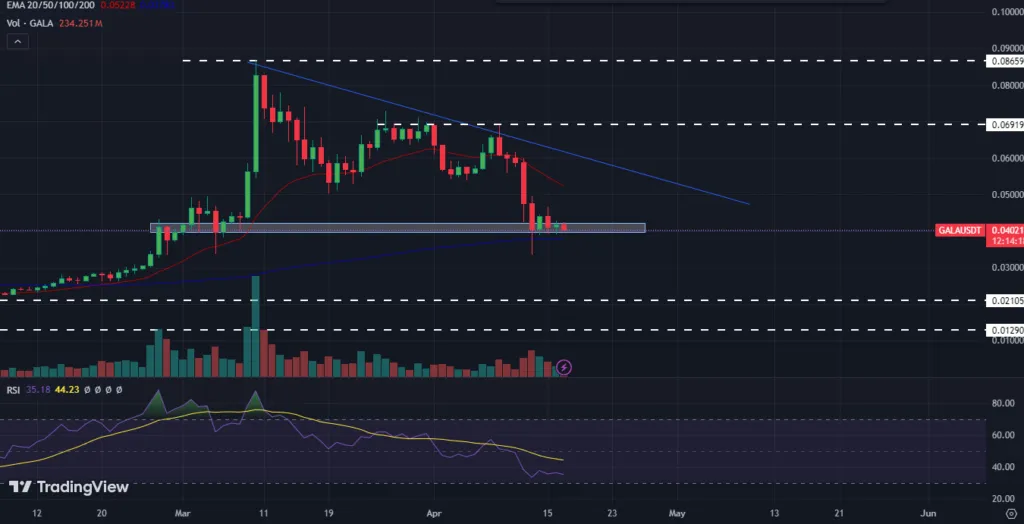
Gala token price has formed a descending triangle pattern in a daily time frame and is currently taking support on the 200-day exponential moving average. Suppose the Gala price takes support on the 200-day EMA; it may approach the 20-day EMA. If the price surpasses the trendline and sustains, it may gain bullish momentum and recover the previous losses.
Alternatively, sellers may become confident if the GALA token price slips below the 200-day exponential moving average, and the price may melt to the support level of $0.0210. Suppose the price fails to defend the $0.0210 mark; it will record a new all-time low.
Based on the technical indicators, the RSI is 25 and continuously declining, facing resistance from the RSI-based moving average. Gala token price has been struggling between the 20-day and 200-day moving averages, indicating the neutral momentum.
Whales Holding
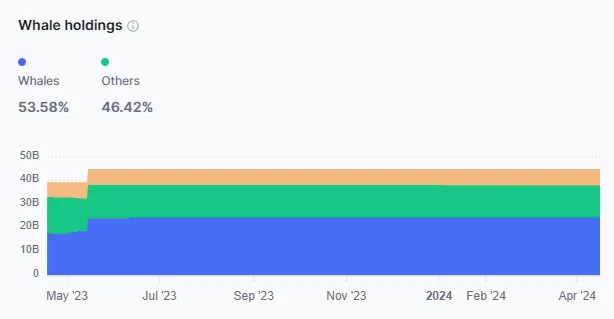
According to the data, whales hold 53.58%, and others hold 46.42%. The whales’ holding has increased by approximately 24% in a year, and the price has remained positive. The current holdings of whales are $24.37 billion, investors are holding $13.61 billion, and retailers are holding $6.99 billion.
Conclusion
In the short term, the Gala price has been in a bearish trend and has melted by 55% in the last 40 days. On a daily time frame, the Gala token price has formed a descending triangle pattern and is currently taking support on the 200-day exponential moving average. Suppose the Gala price starts trading below the $0.0210 level; it may melt to a new all-time low.
Technical Levels
Resistance: $0.0690 & $0.0865
Support: $0.0400 & $0.0210
Disclaimer
This article is for informational purposes only and provides no financial, investment, or other advice. The author or any people mentioned in this article are not responsible for any financial loss that may occur from investing in or trading. Please do your research before making any financial decisions.


