- Quant crypto price has slipped below the 200-day exponential moving average.
- QNT’s price has dropped by 31% in the last three weeks.
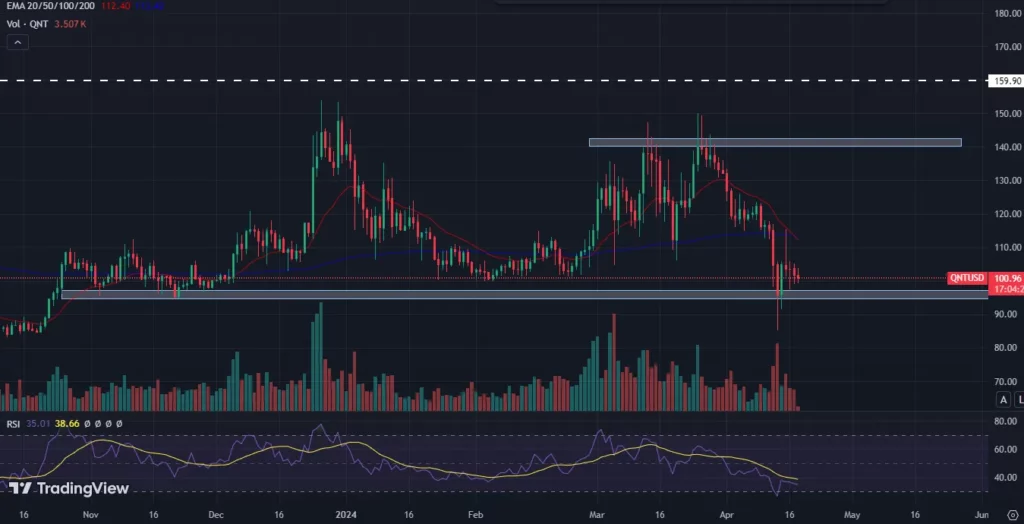
Based on the technical chart, the Quant crypto price has been facing resistance from the $150 hurdle for a year. Quant price tried to surpass the $150 mark last month, but sellers were strong enough to drag down the price. In the past four months, the price has faced rejection thrice from the $150 mark, which shows the domination of sellers at this level.
Quant token price has witnessed intense selling pressure for the last few weeks and has lost approximately 30%. The price has slipped below the 200-day exponential moving average and is defending the $100 mark.
According to the technical indicators, RSI has been declining for a month and heading toward the oversold zone. RSI suggests that sellers have dominated, and the price may remain bearish for the next few days. Quant crypto price is trading below the exponential moving averages, showcasing negative sentiment.
Quant Crypto Volume vs Price Analysis
Based on the graph of volume and price, the trading volume has declined by forming lower lows. The trading volume has dropped from $120 Million to $18 Million monthly, and the QNT price has also performed accordingly. Suppose the trading volume increases, and the price may gain bullish momentum.
Quant Crypto Social Dominance & Social Volume Analysis
As we can see on the chart, the social volume and social dominance suggest that the interaction of Quant crypto on social media has remained constant for the last few months. The change in QNT price may vary according to the shift in social dominance and social volume graph.
Quant Price Technical Analysis Over Daily Timeframe

In a broader time frame, the Quant token price has been taking support on the $100 mark. The price has melted to the support level of $100 and has slipped below the exponential moving averages.
Suppose the QNT crypto price starts trading below the support level of $100 and sustains; sellers may become confident, and buyers may prefer to exit their positions. If it happens so, panic selling can be seen, and the price may keep declining for the next few weeks.
Alternatively, if the QNT price defends the $100 mark and rises, it may gain bullish momentum for the short term. If the Quant token price surpasses the 200-day EMA, it may extend to $150.
Technical Analysis of Quant Token on 4-H Timeframe

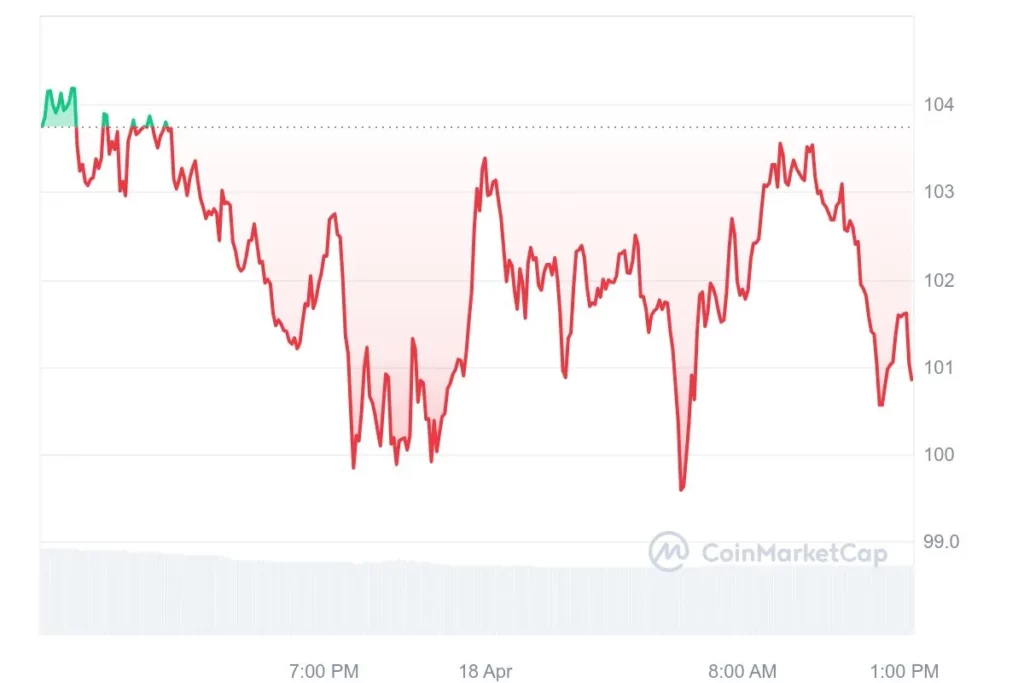
Quant price is trading at $100.38, which has dropped by 1.38% in the last 24 hours. The market capitalization is $1.21 Billion, and the fully diluted market cap is $1.50 Billion. The circulating supply is 12,072,738 QNT, and the total is 14,881,364 QNT.
In a 4-H time frame, the QNT price has been declining due to resistance from a trendline. Suppose the Quant token price surpasses the trendline and is sustained, and buying pressure for the short term can be expected.
On the other hand, if the Quant crypto price fails to surpass the trendline and sellers remain strong, the price may decline more for the next few days.
Conclusion
Based on the technical analysis of the Quant crypto price, the sellers are currently dominating the market. The price has dropped significantly in the last few weeks and is trading below the 200-day exponential moving average. The resistance at the $150 mark is still strong, which indicates that the buyers cannot gain momentum.
Technical Levels
Resistance Levels: $105 & $123
Support Levels: $95 & $84
Disclaimer
This article is for informational purposes only and provides no financial, investment, or other advice. The author or any people mentioned in this article are not responsible for any financial loss that may occur from investing in or trading. Please do your research before making any financial decisions.


