

- Flare (FLR) token price has been struggling between the 20-day and 200-day EMAs.
- FLR price dropped by 35% in the past few weeks.
Since the beginning of this year, Flare witnessed intense buying pressure, gaining 223% in just two months. The bull run ended near the $0.0550 hurdle as the profit booking was seen here. According to the technical chart, FLR performed negatively, and recently, the price has failed to reach the last swing high.
Flare price has been taking support on the $0.0300 mark for the last two months and is currently taking support on this level. The price has been struggling between the 20-day and 200-day EMAs. Recently, it surpassed the 20-day EMA but failed to sustain and melted back to the 200-day EMA.


Flare token price is trading at $0.0317, which has lost 0.72% in the last 24 hours. The market capitalization is $1.22 Billion, and the fully diluted market cap is $3.18 Billion. The 24-hour trading volume is $15.11 Million, with a fall of 2.69%.
Flare Price Has Formed a Descending Triangle Pattern on Daily Timeframe
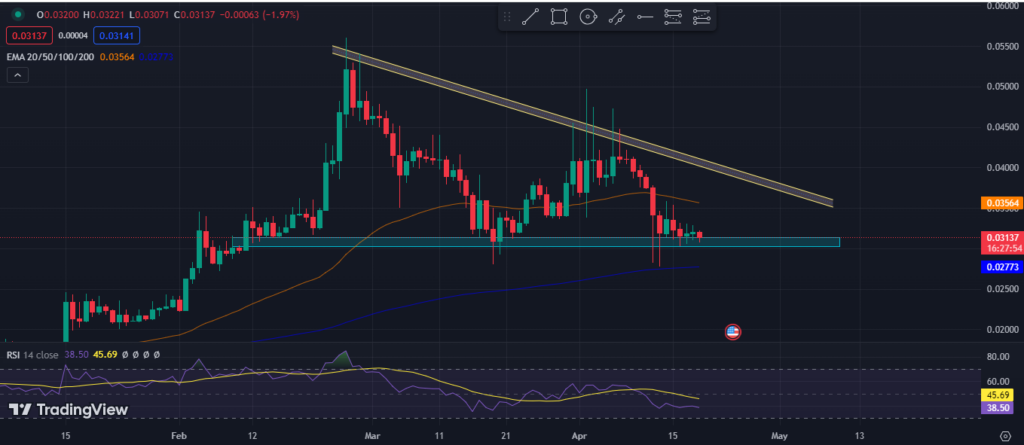
During the daily time frame, the Flare token price has formed a descending triangle pattern and is currently at the support level. Suppose the FLR crypto price slips below the support level of $0.0300 and fails to defend the 200-day EMA; the bullish trend will be over, and selling pressure for the long term can be detected.
In a broader time frame, the Flare has been in a bullish trend and is rising by taking pullbacks. If the FLR price defends the support level of $0.0300, it may gain bullish momentum. If the price surpasses the 20-day EMA, it may extend to the 52-week high in a few weeks and may continue the trend.
Technical indicators suggest that the FLR token price has slipped below the 20-day EMA and is approaching the 200-day EMA, which indicates the bears’ grip. RSI is 39, falling below the RSI-based moving average, showing sellers’ dominance.
Technical Analysis of Flare Over 4-H Timeframe
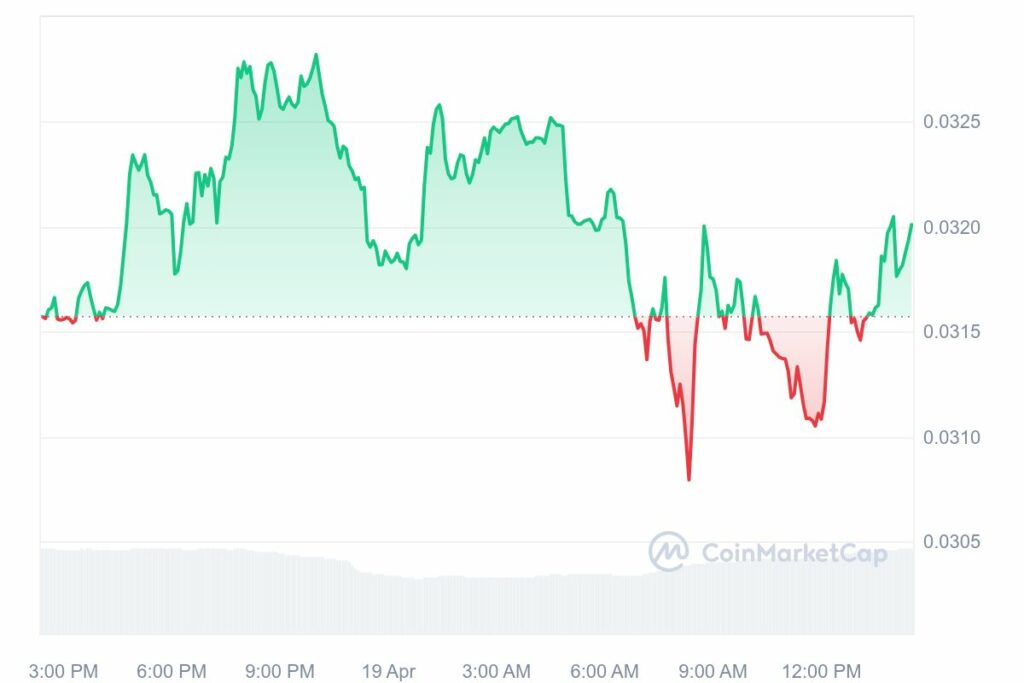
In a 4-H time frame, the Flare crypto price forms a descending triangle. If the FLR token price surpasses the 20-day exponential moving average and sustains, then the price may recover losses this month.
Alternatively, if the Flare crypto price slips below the support level of $0.0310, sellers may become confident, leading to a bearish trend for the short term.
Price Vs. Volume Analysis
According to the graph, the trading volume of Flare crypto has been declining since the beginning of this month. The trading volume has dropped by $210 Million to $15.85, and the price is down by 36% in a month. The trading volume has settled down, and a positive spike in volume may lead to a bullish momentum.
Conclusion
Flare price has witnessed negative momentum for the last few weeks and has dropped by forming lower swings. It has declined by 36% in a month, which indicates the bearish momentum. The FLR token price forms a descending triangle pattern during a daily time frame. According to the analysts, the Flare price may witness selling pressure below the 200-day EMA. Suppose the FLR price triggers a breakout from the descending triangle pattern; the price may extend to a 52-week high.
Technical Levels
Resistance Levels: $0.0420 & $0.0500
Support Levels: $0.0300 & $0.0240
Disclaimer
This article is for informational purposes only and provides no financial, investment, or other advice. The author or any people mentioned in this article are not responsible for any financial loss that may occur from investing in or trading. Please do your research before making any financial decisions.


