

- Gas crypto has witnessed a surge in its trading volume in the last 24 hours.
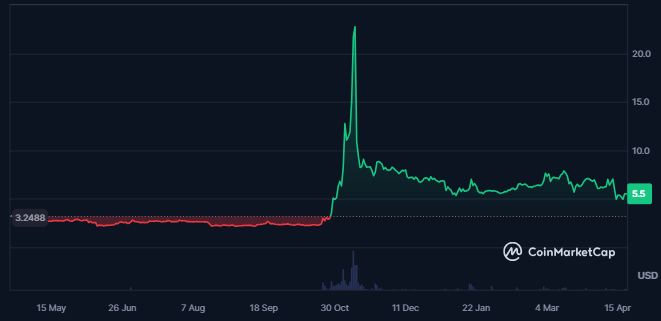
- The price of the crypto has advanced by 67.25% in the last 1 year.
Gas is the utility token of the NEO blockchain, used for transaction fees and network maintenance incentives. It’s generated by holding NEO and can be traded on exchanges. Created by the NEO team in 2014, GAS accompanies NEO’s rebranding from Antshares in 2017, serving as a vital blockchain component.
The circulating supply of the crypto is 67.576 Million GAS which is similar to the total supply of the crypto. Also, the maximum supply of the crypto is 100.0 Million GAS and the fully diluted market cap of the crypto is $371.898 Million.


Gas crypto has a volume/market cap ratio of 21.97% which is enough for a highly liquid crypto. Moreover, the trading volume of the crypto has surged by 340% in just last 24 hours.
The market cap value of the crypto has also advanced by 10.06% in the last 24 hours in the last 24 hours resulting in a market cap value of $370.101 Million. The market cap ranking of the crypto is 175th as per CoinMarketCap and the market cap dominance of the crypto is 0.02%.
The supply inflation of the crypto is extremely high resulting in 597.19% and the volatility of the crypto is also high which further results in 9.65%. The sentiment of the crypto is also bearish and the fear and greed index represents greed.
GAS Crypto Derivatives Analysis
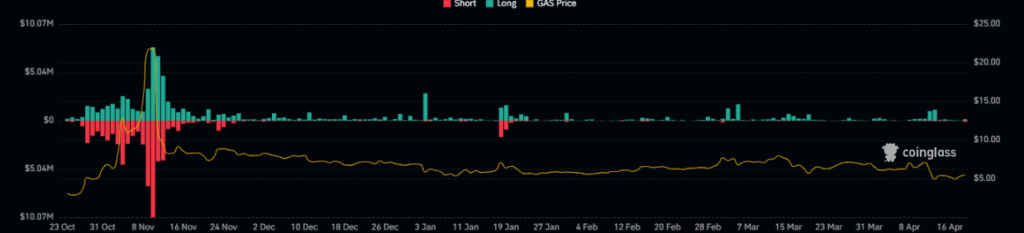
The derivatives traded volume of the crypto has also witnessed a huge surge of 172% in the last 24 hours which is further followed by an advance of 55% in the open interest.
The recorded open interest for the crypt in the last 24 hours is $21.02 Million and the value of the derivatives traded volume is $171.53 Million. Also, the long liquidation for the crypto is $147.63K and the short liquidation is $126.41K.
GAS Crypto Technical Analysis
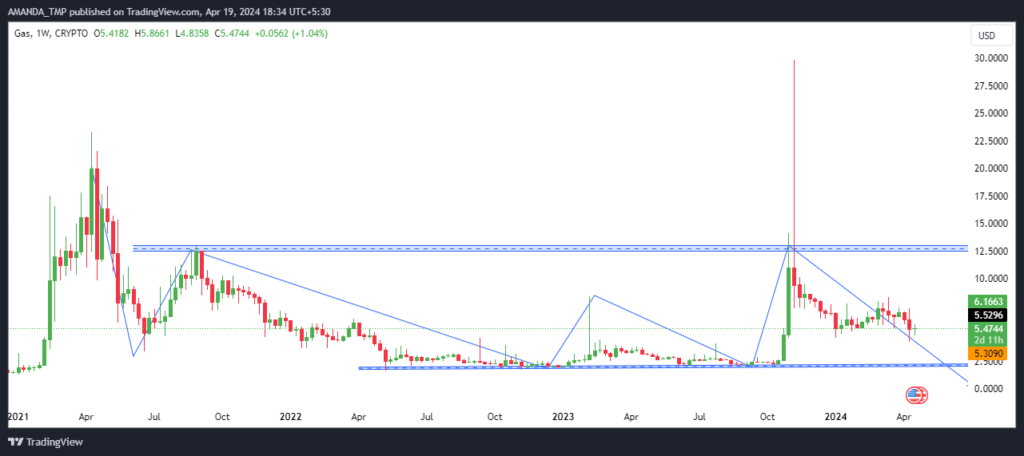
The price of the GAS crypto has been witnessing huge volatility over the last few months and has been revolving around a zone. This is followed by uncertain spikes and fake breakouts in the trading price of the crypto.
The candlesticks formed on the weekly chart of the crypto is forming uncertain price action which is making the prediction of the price uncertain unless it breaks in either direction.
GAS/USD Chart by TradingView
The price and the value of the EMAs on the chart are consistently declining following which the price of the crypto has slipped below the 50-day and the 200-day EMAs. The 50-day EMA further is approaching towards the 200-day EMA which might lead to a death cross in the future.
The MACD indicator depicts strong bearishness in the price as the MACD and the signal line are trading in a bearish cross and has declined below the zero level.
The RSI indicator is also supporting for weakness in the price of the GAS crypto as the RSI has declined below the 14-day SMA. The RSI further has declined from the overbought zones and is currently trading at a level of 42.7.
Summary
Gas crypto sees a surge in trading volume, but price movement remains uncertain. With a circulating supply matching total supply and a high supply inflation rate, GAS faces volatility. While derivatives trading volume spikes, technical analysis suggests uncertain price action, as it hovers around key support levels amidst bearish indicators.
Technical Levels:
- Support Levels: $1.9700 and $4.330
- Resistance Levels: $14.290 and $29.830
Disclaimer
This article is for informational purposes only and does not provide any financial, investment, or other advice. The author or any people mentioned in this article are not responsible for any financial loss that may occur from investing in or trading. Please do your research before making any financial decisions.


