

- GMX coin price is trading below the significant moving averages indicating the sellers’ dominance.
- GMX token price has been struggling below the $60 hurdle.
GMX price chart structure shows that the price has been struggling to surpass the $60 mark for a year. Every time, the GMX token price chart shows price rejection from the $60 hurdle and bulls are dragging down the price by approximately 30% in just a few days.
The GMX price has been defending the $40 level for the last few months since the beginning of this year. However, in mid-March, the GMX price faced resistance from the $60 level and melted to the $40 mark but it failed to defend the $40 level and witnessed selling pressure of 40%.


GMX Crypto Volume Has Dropped by 70% Weekly; What’s Next?
According to the graph, the trading volume was $100 Million in March but is currently at $20 Million. The huge changes in trading volume have dragged down the price by 60% in a month. Any positive changes in the price may help the price to gain bullish momentum.
Social Dominance and Social Volume Keep Declining
According to the given data, awareness of GMX crypto on social media has decreased over the last few months. Currently, social dominance and social volume are running constantly but any changes in it may impact the trend of GMX crypto price.
Will GMX Token Price Record a New All-time Low Soon?
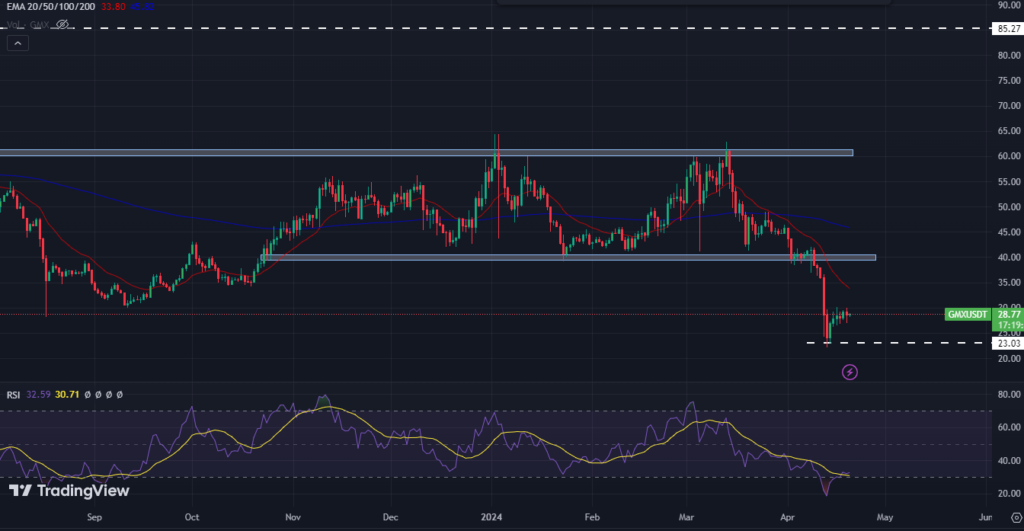
GMX crypto chart displays that the price has witnessed a strong selling pressure of 54% in more than a month. It has recorded an all-time low of $22.15 on March 13, 2024. Currently, the price has been declining by facing resistance from the 20-day EMA. It has risen by 29% in a week and heading toward the 20-day EMA.
If the GMX coin price extends to the 20-day EMA and sellers may show interest then a bearish forecast can be generated. If the GMX price forms any bearish candlestick near the 20-day EMA then sellers may eye for a new all-time low. Suppose the GMX price bounces back and sustains over the 20-day EMA, the price may approach the $40 hurdle soon.
However, if the GMX price enters the channel and sustains, buyers may lift the price to the strong resistance level of $60. If the GMX price manages to surpass the $60 hurdle with strong volume, investors may become confident, and buying momentum for the long term can be seen.
The technical indicators suggest that the RSI has been falling by facing resistance from the RSI-based moving average, demonstrating weakness. GMX crypto price is trading far below the exponential moving average, highlighting seller dominance.
GMX Coin Price Prediction Over 4-H Timeframe
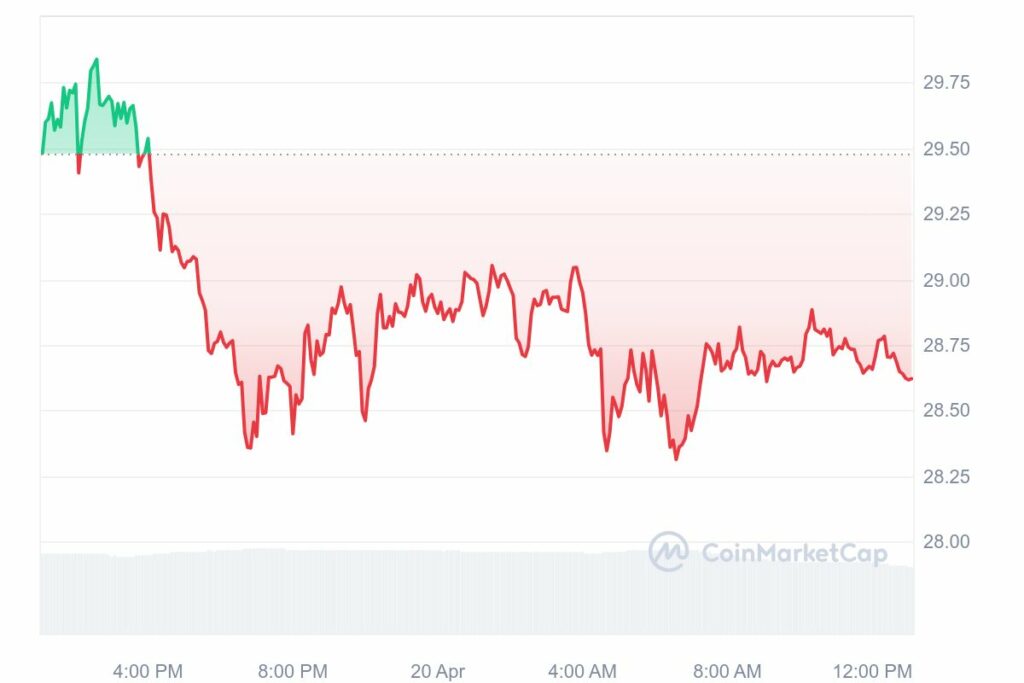
GMX token price has formed a descending triangle pattern on a 4-H time frame. Suppose the GMX price triggers a breakout from the descending triangle then the price may approach the 200-day exponential moving average.
On the other hand, if the GMX coin price slips below the $26 level, the price may record a new all-time low. The current market price of GMX is $28.60 which has increased by 0.14% in the past 24 hours.
Conclusion
GMX price has been in a strong bearish trend and recently recorded a new all-time low. Most of the technical indicators suggest a bearish forecast. According to the analysts, the GMX price may remain bearish below the 200-day EMA, and buying momentum can be seen over the $60 mark.
Technical Levels
Resistance Levels: $40 & $60
Support Levels: $24 & $20
Disclaimer
This article is for informational purposes only and provides no financial, investment, or other advice. The author or any people mentioned in this article are not responsible for any financial loss that may occur from investing in or trading. Please do your research before making any financial decisions.


