

- The trading volume has increased by 25% in the last 24 hours.
- VVS Finance price has declined by 50% this month.
VVS price chart structure shows that the price has risen by forming higher highs and higher lows. The VVS price is recovering from the all-time low and has extended to the $0.00000600 hurdle. The bullish trend has interrupted near the $0.00000600 hurdle and showed continuous wick rejection.
VVS Finance’s price has slipped below the 20-day exponential moving average and is taking support on the 200-day exponential moving average. On March 05, 2024, the VVS crypto price was pumped by 60% but was immediately dumped to the initial cost.


Current Price – $0.00000405 Fear & Greed Index – 66 (greed)
Market cap – $184.08 million Green days – 13/30 (43%)
Volume – $1.37 million Sentiment – Bearish
Price Prediction – $0.00000467 (15.47%) Volatility – 6.78%
RSI – 40 200-day EMA – $0.00000383
According to our analysis, the VVS Finance price is predicted to range between the $0.00000380 and $0.00000480 levels. The fear and greed index is 66 (greed), and the volatility is 6.78%. The VVS crypto price has remained bullish for 13 days in the last 30 days, indicating the bears’ grip.
VVS Finance price is trading at $0.00000405 with an intraday gain of 0.12%. The market capitalization is $184.08 Million, and the 24-hour trading volume is $1.37 Million, which rose by 25%.
VVS Crypto Price Technical Analysis Over Daily Timeframe
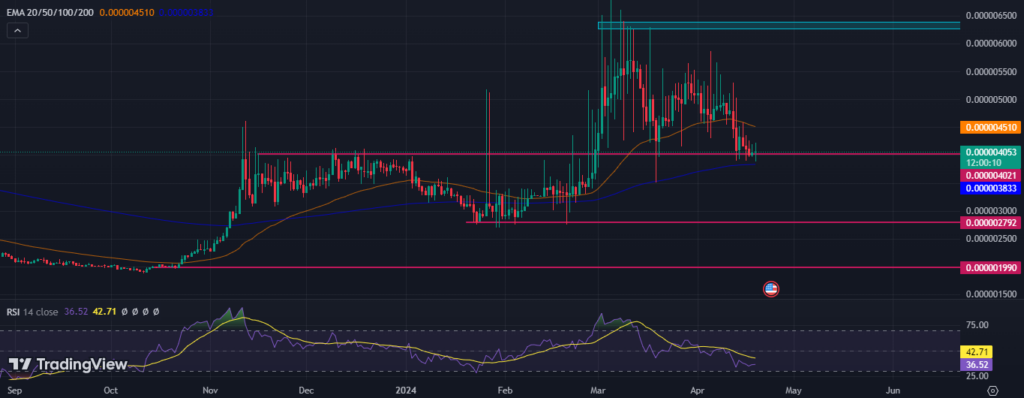
On a daily time frame, the VVS price has been in a bearish trend in a broader time frame, but buyers seem to be strong in the short term. The VVS Finance price has melted to the 200-day EMA and may form higher lows.
According to the chart structure, the VVS price may form a higher low and gain bullish momentum again to reach the last swing high. If the price takes support on the 200-day EMA and rises, it may continue the bullish trend.
Suppose the VVS price slips below the 200-day exponential moving average; the price may quickly melt to the last swing low. However, if the VVS price starts trading below the previous swing low, then the price will record a new all-time low.
Based on the technical indicators, the VVS crypto price has slipped below the 20-day EMA but is taking support on the 200-day EMA, which indicates neutral momentum. RSI has continuously fallen and is currently in the oversold zone.
VVS Finance Crypto Volume vs Price Analysis
Since March, the trading volume has kept falling, and the price has also dropped. The trading volume has declined by 65% in the last six days, which has negatively impacted the price. The change in trading volume may affect the VVS price.
VVS Crypto Social Volume and Social Dominance Analysis
As we can see on the graph of social dominance and social volume, the interaction and information about VVS crypto has increased on social media in the last few weeks. However, the VVS price has not performed well yet, so it may gain bullish momentum in the next few days.
Conclusion
The VVS price has been in a bearish trend in a broader time frame, but bulls seem to be dominating in the short term. It is recovering from its all-time low and rising by taking pullbacks. The bullish trend has disturbed near the $0.00000600 hurdle and shown wick rejection. The trading volume has decreased since March, but the social dominance and social volume have increased.
Technical Levels
Resistance Levels: $0.00000540 & $0.00000640
Support Levels: $0.00000400 & $0.00000280
Disclaimer
This article is for informational purposes only and provides no financial, investment, or other advice. The author or any people mentioned in this article are not responsible for any financial loss that may occur from investing in or trading. Please do your research before making any financial decisions.


