

- There has been no significant volume activity in the Tron crypto over the last 24 hours.
- The TRX coin price is advancing by following a dynamic trendline.
Tron, founded by H.E. Justin Sun, offers a decentralized platform for DApps with high throughput and scalability. Its native token, TRX, is used for transaction fees and staking.
Tron’s ecosystem includes DeFi, stablecoins, and BitTorrent integration. Sun, an entrepreneur with previous successes, remains actively involved in the project’s development and expansion.


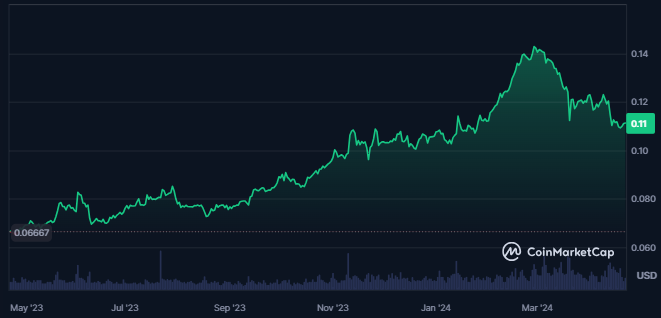
The market cap of the Tron crypto is trading flat and has witnessed a slight advance of 0.16% in the last 24 hours. Despite this, the trading volume of the crypto witnessed a 15.2% advance, which resulted in a traded value of $261.128M.
The market cap value of the Tron crypto is $9.754B, which makes it the 15th largest cryptocurrency in the world. Also, the crypto’s volume/market cap ratio is 2.67%, showing medium liquidity in the crypto price.
The circulating supply of the crypto is 87.591B TRX, which is similar to its total supply. Moreover, the maximum supply of the crypto is infinite, and the fully diluted market cap of the token is 9.754B.
The volatility of the Tron is medium, resulting in 3.74%, and the crypto’s market cap dominance is 0.42%. Also, the sentiment of the Tron crypto is bearish, and the crypto’s fear and greed index index shows greed among the investors.
Tron Crypto Derivatives Analysis
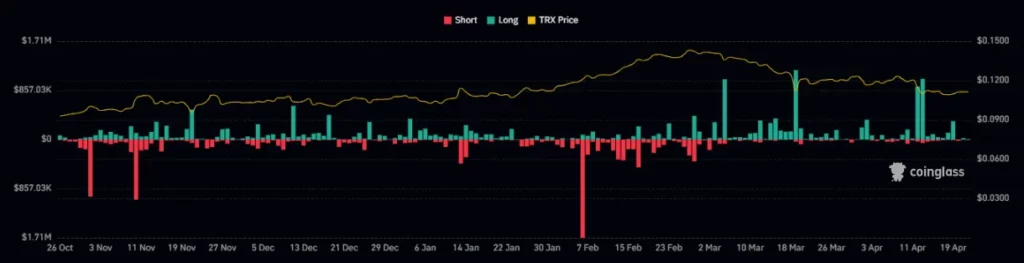
The trading volume of crypto derivatives has witnessed an increase of 8.3% in the last 24 hours. This further results in a traded value of $82.32M, and the open interest of the crypto has declined by 1.42%.
Furthermore, the long and short liquidations for the Tron crypto are almost similar, showing uncertainty between buyers and sellers.
Tron Crypto Technical Analysis
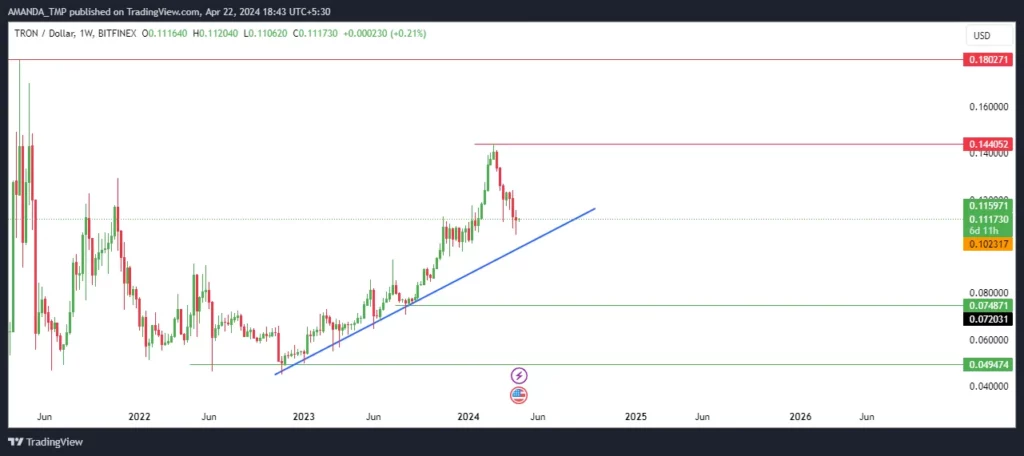
On the weekly charts, the TRX crypto price has been consistently advancing to higher levels, followed by the formation of higher high swings. Following the most recent swing high of $0.1440, the crypto price has declined by 20%. If the crypto’s price further breaks above the last swing, further buying momentum might be seen.
TRX/USD Chart by TradingView.com
Although the 50-day and the 200-day EMAs are trading in a Golden Crossover, the price has declined below the 200-day EMA. The 50-day EMA is approaching the 200-day EMA with the decline in the price of the TRX crypto.
The MACD and the signal line overlap and trade below the zero level, indicating the dominance of sellers. The histograms formed on the MACD indicator are also bearish.
The RSI has also overlapped the 14-day SMA and is trading below the 50 level. This further shows bearish momentum in the trading price of the crypto.
Summary
Despite a dynamic trendline and recent volume activity, Tron’s TRX crypto faces bearish sentiment with a flat market cap, declining open interest, and a slight price decline. Technical indicators show a bearish trend, with TRX price below key EMAs and MACD signaling seller dominance. Uncertainty persists amidst similar long and short liquidations.
Technical Levels:
- Support levels: $0.0490 and $0.7480
- Resistance levels: $0.1440 and $0.180
Disclaimer
This article is for informational purposes only and does not provide any financial, investment, or other advice. The author or any people mentioned in this article are not responsible for any financial loss that may occur from investing in or trading. Please do your research before making any financial decisions.


