

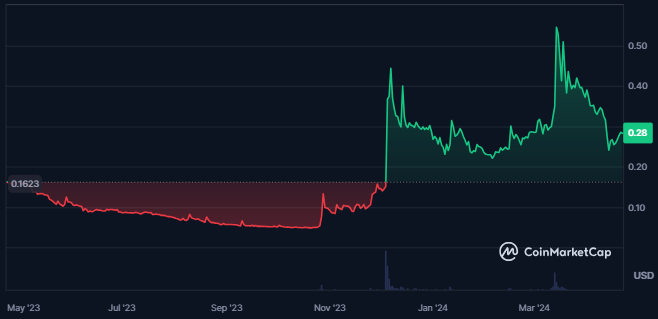
- AURORA crypto is forming a bullish pattern on the chart.
- The price of the AURORA crypto has advanced by 72% in the last year.
Aurora, founded by Alex Shevchenko, bridges NEAR blockchain’s speed with Ethereum’s ecosystem. It functions as an EVM, offering scalability and compatibility. $AURORA, its native token, aids governance via AuroraDAO and guides protocol upgrades. Its trustless Rainbow Bridge seamlessly facilitates asset transfers between Ethereum, NEAR, and Aurora.
The volume of the Aurora crypto has shown a good spike of 22 in the last 24 hours, which shows that the activity in the crypto is increasing. That could signify that traders and investors are attracted to the crypto.


Despite the huge advance in volume, the crypto’s market cap has slightly declined by 2.18% in the last 24 hours. resulting in $124.736M. Also, the crypto’s volume/market cap ratio is 1.41%.
The current circulating supply of Aurora is 447.703M AURORA, and the total supply of the crypto is 999.943M AURORA, followed by a fully diluted market cap of $277.67M. Also, the Aurora token currently has 5.9K holders and a total transfer of 100K, as per Etherscan.io.
Aurora crypto has a total value locked of $27.66M and the stablecoins market cap of the crypto is $2.11M. Furthermore, the recorded inflows in the last 24 hours for the crypto is $7.8K, and the total raised amount by the crypto is worth $102M.
Social Dominance Vs Social Volume For Aurora Crypto
The social dominance of the Aurora crypto is at its most significant lows, followed by the decline in the social volume. It shows that the crypto has significantly fewer followers on its social media handles and is less active.
AURORA Crypto Technical Analysis
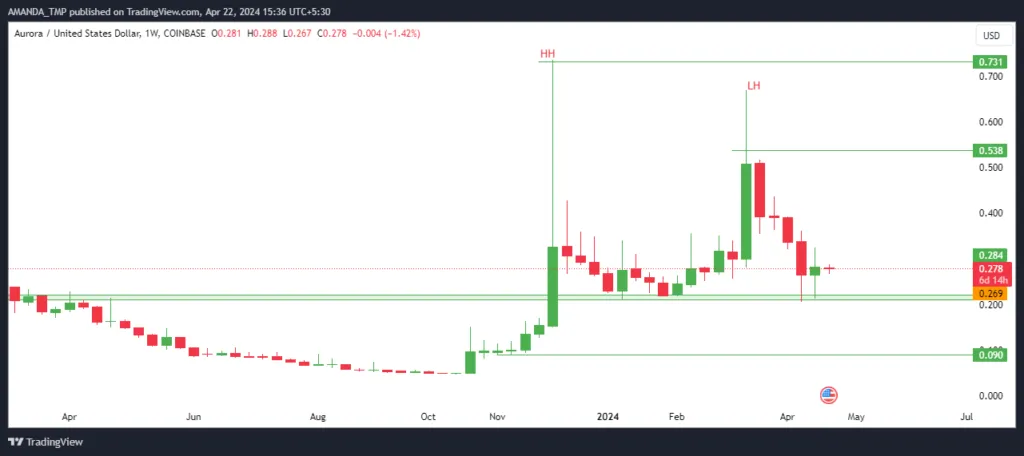
The price of the AURORA crypto has been forming a higher high pattern on the weekly chart and is slowly advancing to higher levels. Despite this bullish behavior, the crypto price has been witnessing profit booking for the last few weeks, but it is currently sustaining above the breakout zones.
If the crypto’s price further forms the bullish candlestick pattern, It might lead to the previous swing high of $0.67.
AURORA/USD Chart by TradingView
The 50-day and the 200-day EMAs are trading in a golden cross while the price of the crypto has declined to the 200-day EMA and is bouncing back. Currently, the price revolves around the EMA bands, and if it breaks further above the 50-day EMA, a further surge in the price of the crypto might be witnessed.
The MACD and the signal line show weakness in the overall crypto’s trend as the following metrics are trading below the zero level. Despite this, the following metrics have formed a bullish cross on the daily crypto chart.
The RSI is also trying to advance to the higher levels as it has bounced back from the oversold zone and has broken above the 14-day SMA.
Summary
The current bullish pattern and increased trading activity in Aurora crypto suggest potential interest from traders and investors. However, its social media presence and volume are relatively low. Technical analysis indicates a possible upward trend continuation, but uncertainties persist regarding market sentiment and price direction.
Technical Levels
Support Levels: $0.09 and $0.210
Resistance levels:$0.530 and $0.730
Disclaimer
This article is for informational purposes only and does not provide any financial, investment, or other advice. The author or any people mentioned in this article are not responsible for any financial loss that may occur from investing in or trading. Please do your research before making any financial decisions.


