

- Traders’ interest in Pendle crypto is waning as the volume has declined.
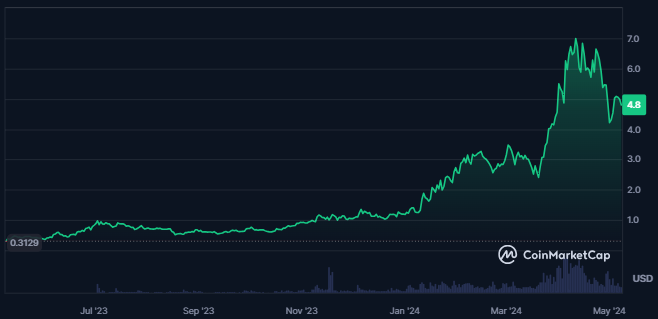
- The crypto price has outperformed 95% of the top 100 crypto assets in 1 year.
Pendle is a pioneering protocol facilitating the trading of tokenized future yield on an AMM platform. It empowers holders of yield-generating assets to earn extra yield and secure future yields in advance.
The PENDLE crypto has good liquidity based on its market cap and has shown 11 green days in the last 30 days. The market cap dominance of the cryptocurrency is 0.05%, followed by a market cap value of $1.15 Billion.


The crypto market cap ranking is #72 as per CoinMarketCap at press time, and the total value locked for the crypto is $91.27 Billion. Moreover, the value of the traded volume for the crypto in the last 24 hours is $91.27 Billion.
The Pendle crypto’s volume/market cap ratio is 4.38% and hit an all-time high price of $7.52 nearly a month ago. Also, the all-time low price achieved by the crypto is $0.3349, and the crypto price has since advanced by 14314%.
The total supply of the crypto is 258.185M PENDLE. Its circulating supply is 239.185M PENDLE, and the fully diluted market cap is $1.243 Billion.
Also, the circulating supply market cap of the crypto is $465.819 Million, and there are 23.8K token holders, according to Etherscan.
Why Are Derivatives Of The Pendle Crypto Supporting Bears?
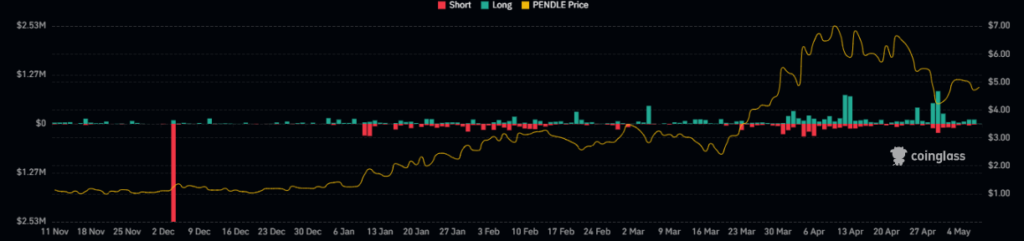
The liquidation chart of the Coinglass shows that the Pendle crypto has been consistently witnessing higher long liquidations for many days.
Even in the last 24 hours from press time, the recorded long liquidation of the crypto is worth $99.5K, whereas the short liquidation is just $8.25K.
Despite this, the derivatives volume for crypto is also declining, following the open interest decline by 6.4% 24 hours after writing.
The following behavior of the derivatives data shows the decline in the trader’s crypto activity followed by the bear dominance.
Are Technical Charts Of The PENDLE Crypto Also Supporting The Bears?
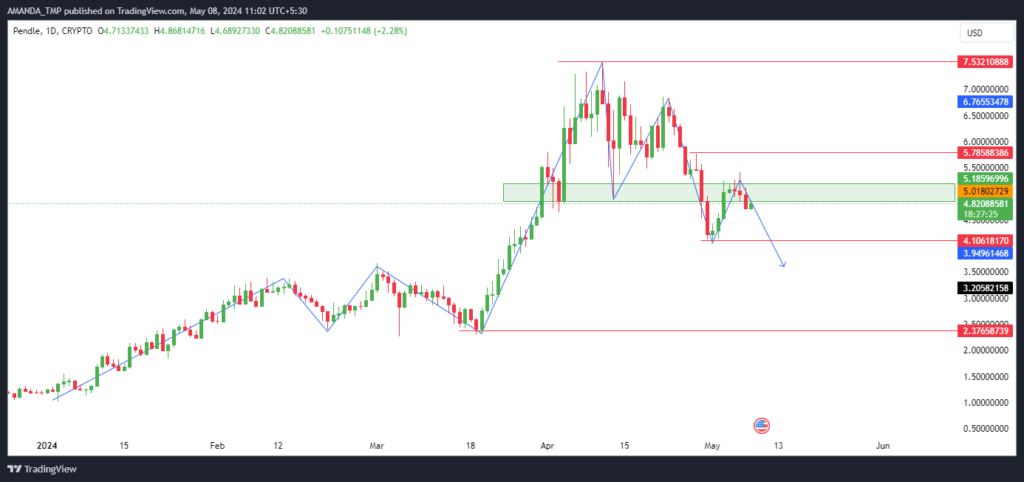
The PENDLE crypto’s market structure looks bearish as the crypto price has been consistently declining to lower levels for the last 25 days.
The price has also formed lower highs on the chart and has broken below the crucial change of character (CHOCH) level, further confirming the crypto’s bearish trend.
PENDLE/USD Chart by TradingView
The 50-day and the 200-day EMAs are trading in a golden cross while the crypto price has declined below the 50-level. It shows that the bears have started profit booking in crypto.
The MACD indicator further gives a sell signal on the daily chart as the MACD and the signal line are trading in negative territory in a bearish cross.
From the overbought zone, the RSI has declined below the 50-level and the 14-day SMA and is trading at 43.8 at press time. This shows the declining momentum in the price of the PENDLE crypto.
Summary
Traders’ interest in Pendle crypto appears to be diminishing, with declining volume and higher long liquidations indicating bearish sentiment.
Despite its impressive year-over-year performance, technical charts suggest a bearish trend, with consistent price declines and lower highs.
Key indicators, including EMAs and MACD, support the bearish outlook, signaling potential downside.
As the overall factors support weakness in the crypto price, Thus if the price continues to decline, it might take support at the levels of $2.3 and $4.10. If the crypto price further reverses, the strong resistance level where it might face selling pressure is $5.75 and $7.50.
Disclaimer
This article is for informational purposes only and does not provide any financial, investment, or other advice. The author or any people mentioned in this article are not responsible for any financial loss that may occur from investing in or trading. Please do your research before making any financial decisions.


