

- Ordinal price has dipped below the key moving average.
- Ordinal crypto prices have been struggling below the $80 hurdle this year.
According to the technical chart, the Ordinal crypto price has been struggling below the $80 hurdle since January 2024. In the first week of April, the ORDI price approached the $80 hurdle and faced resistance. Sellers were strong and dragged down the price by around 50% till now.
The recent fall has paused near the $30 mark as the ORDI price has formed a hammer candlestick, a strong trend reversal candlestick. The asset price is up by 16% in a week but facing resistance from the $40 hurdle.


RSI has generated a bullish crossover and stays over the RSI-based moving average. MACD has formed green histograms, and a golden crossover has been generated.
Ordinal Price Analysis: Will It Reach $80 This Month?
ORDI price has been in a bearish trend for the past few weeks and is trading below the key moving average. The asset price has faced resistance from the $40 mark and has formed continuous negative candlesticks.
If ORDI exceeds and sustains over the 20-day exponential moving average, buying momentum could be generated. Suppose the trading volume increases, the MACD line surpasses the Zero line, and buyers show interest, which may lead to a bullish momentum.
Suppose Ordinal crypto price is below the $40 mark, forming a strong bearish candlestick, and sellers may dominate. Strong selling pressure can be seen if the price slips below the last swing low.
ORDI Price Technical Analysis Over 4-H Timeframe
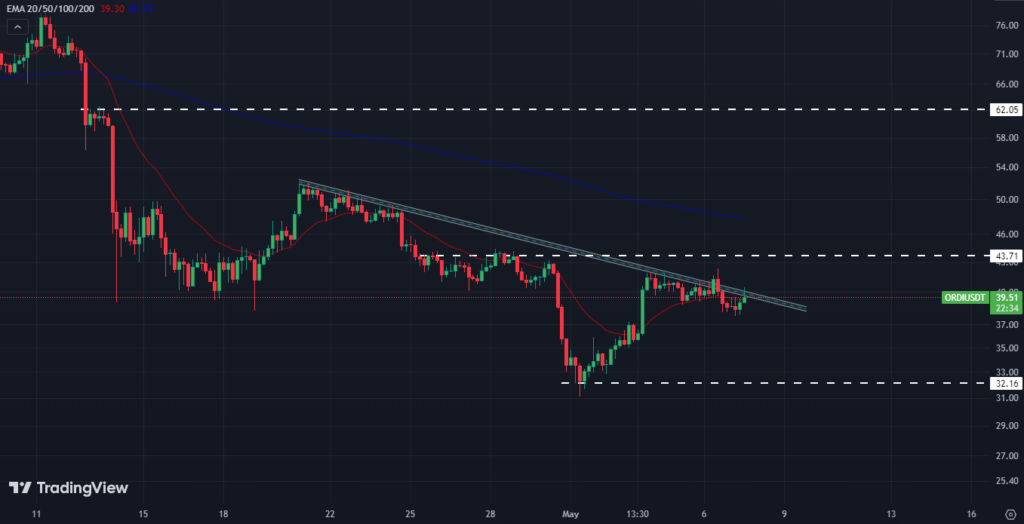
The technical chart displays that the ORDI price is declining by facing resistance from the falling trendline. If the price triggers a breakout from the trendline and sustains it, then the price may extend to the 200-day EMA.
Assuming the asset price consolidates near the 200-day EAM and prompts a breakout, then this can turn into a bullish trend in the long term.
On the other hand, if the ORDI price fails to exceed the trendline and sustains below the 20-day EMA, sellers may become confident, and the recent bearish momentum may continue.
When writing, the Ordinal crypto price was traded at $38.84, up by 0.44% in an intraday session. The market capitalization is $814.54 Million, and the trading volume is $164.00 Million. The fully diluted market cap is $815.40 Million, and the circulating supply is 21,000,000 ORDI.
Conclusion
Based on the technical analysis, the ORDI price seems precarious, as it has been struggling below the $80 hurdle for a while now. Recent developments, such as forming a strong trend reversal hammer candlestick, indicate that some bullish momentum is building up. Additionally, bullish crossovers in the RSI and MACD indicators further reinforce this outlook.
Technical levels
Resistance Levels: $41.00 & $51.00
Support Levels: $32.00 & $19.00
Disclaimer
This article is for informational purposes only and provides no financial, investment, or other advice. The author or any people mentioned in this article are not responsible for any financial loss that may occur from investing in or trading. Please do your research before making any financial decisions.


