
- The RNDR crypto price has given a breakout from a bullish flag at $9.00.
- A decrease of 1.61% has been observed in the Render price during the weekly trading session.
- 24-hour trading volume has increased 99.15% in the last 24 hours.
Launched in 2017, Render (RNDR) connects artists and studios needing GPU computing power with mining partners. Built on Ethereum Blockchain, It works as a distributed GPU rendering network. The native token RNDR has gained a lot of appreciation from investors since February 2024. The crypto also created a new all-time high mark in March 2024. And in the present, the buyers are aiming for something big!
Will Render Crypto Witness a New All-time High Mark? Crypto Whale!
The month of February became a significant turning point for many cryptocurrencies across the world, and RNDR crypto is also one of them. The price collectively recorded over 110% positive profitability during Feb and Mar 2024. The situation has completely changed the market psychology into strong bullish sentiments.


However, the crypto faced some initial profit bookings phase in April 2024, resulting in over 30% decline in price. But that doesn’t stop buyers from approaching Render once again in the current month. They rallied the crypto price by over 40%, and the situation is indicating an upcoming all-time high mark.
According to the @santimentfeed X account (formerly known as Twitter), the volatility in price can be expected to be high. The following post shows the some details;
🐳 Whale activity has been high among the #AI sector, and #Render has been no exception. A known whale sent 4.89M $RNDR (worth $52.1M) to an unknown wallet earlier today as prices corrected. Those holding this asset should watch for increased volatility. https://t.co/AIKq9INw1M pic.twitter.com/EG1Rd1HhcA
— Santiment (@santimentfeed) May 23, 2024
That can happen because of the recent activity of a crypto Whale who transferred 4.89M $RNDR (Worth $52.1M) as the price corrected. Those who are holding this asset should prepared for increased volatility.
Technical Analysis of the Render (RNDR/USD)
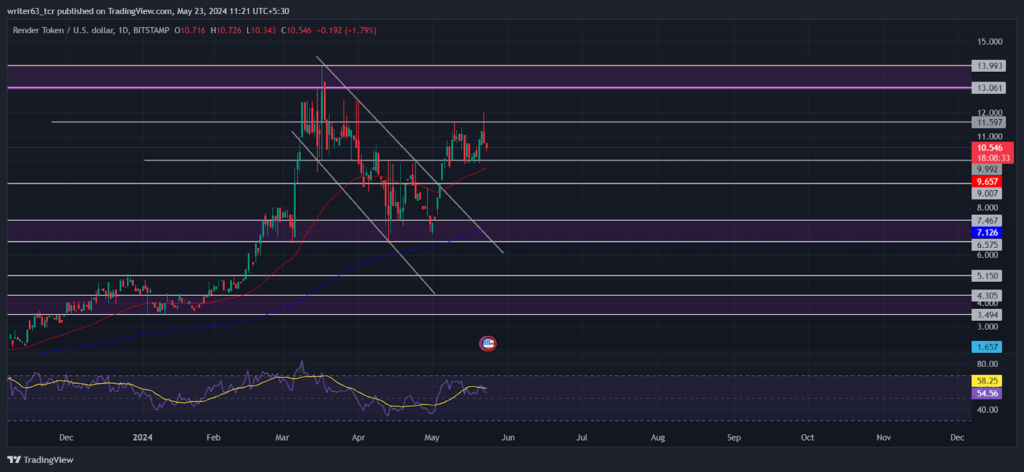
The RNDR price is above the key exponential moving averages, reflecting a bullish outlook. The 50-day EMA can be a dynamic support for the price, and the 200-day EMA remains reserved for major changes.
RNDR price has given a breakout from a bullish flag pattern at $9.00. The price reflected a 28% upward move to the $11.59 level afterward. The sellers have shown their presence at the $11.59 level in the last two trading sessions.
However, the current selling strength does not seem strong enough to significantly change price direction. As per the market speculations, the price reflects the bullish outlook toward a new all-time high mark.
The relative strength index (RSI) shows a minor internal bearish divergence in the price momentum. It reflects that sellers lack enough strength to get a grip on the current price. The RSI is moving at 55.06 below the signal line.
Summary
Render Crypto has ended the bullish correction phase on May 4, 2024. The price has recorded a 28% upsurge after the breakout of the bullish flag pattern. The technical indicators summary also suggested a bullish signal in the current session. The RNDR crypto reflects a bullish outlook, which can lead to a new all-time high.
Technical Levels
The immediate resistance for the RNDR price was $11.59, while the $9.00 level was the next support. If the price breaks above the upper resistance level, a short-term upsurge in price can be seen.
Disclaimer
The views and opinions stated by the author or any people named in this article are for informational purposes only. They do not establish financial, investment, or any other advice. Investing in or trading crypto or stock comes with a risk of financial loss.


