
- Celestia (TIA) recorded higher long liquidations over the last 24 hours.
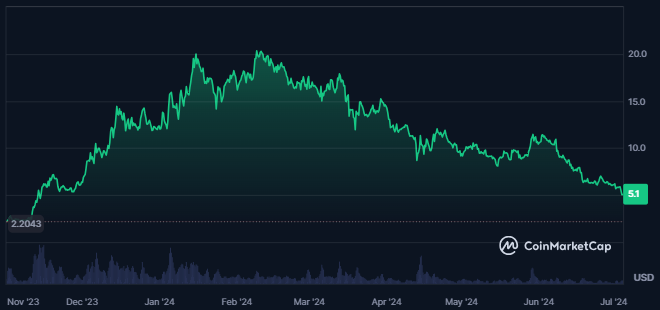
- TIA declined by 75% from its all-time high (press time).
The public holds around 20% of the TIA token supply, while the R&D ecosystem holds 26.8% of the crypto. Celestia raised $1.5 Million in seed funding, the major investors were from the Interchain Foundation.
The Celestia crypto price volatility is very high at 20.78%, which shows that we might get to see uncertain spikes soon. The sentiment of the crypto is bullish, as per CoinMarketCap.


The market cap of Celestia has declined by 11.7% in the last 24 hours, while the trading volume of the crypto has advanced by 56%, which shows strength in the declining momentum.
The TVL of the crypto is nil while it has inflows of $1.5 Million, and its fully diluted market cap had declined by 50% in the last 30 days. Trading volume declined over the last 30 days to $2.34 Billion.
What do Derivatives Have for Celestia Crypto?
Long liquidations worth $1.24 Million were recorded in the Celestia crypto in the last 24 hours, whereas, the short liquidation was worth only $13.29K.
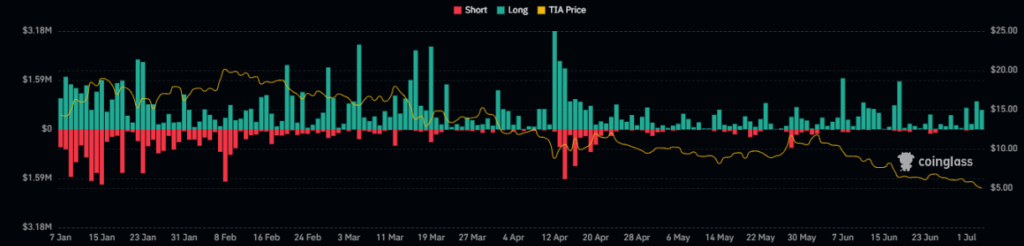
The liquidation chart of the crypto further shows huge long liquidations in the crypto over time. The following data shows that bears have ruled over the price for a long time.
The value of the derivatives traded volume for the crypto in the last 24 hours has advanced by 82%. This has resulted in a traded value of $316.33 Million while the open interest of the crypto has declined by 11.6%.
TIA Crypto Technical Analysis
A falling wedge pattern can be seen in the technical chart of TIA crypto. Additionally, lower low swings followed by lower highs on the charts can be seen. This has led to a consistent decline in the price of the crypto.
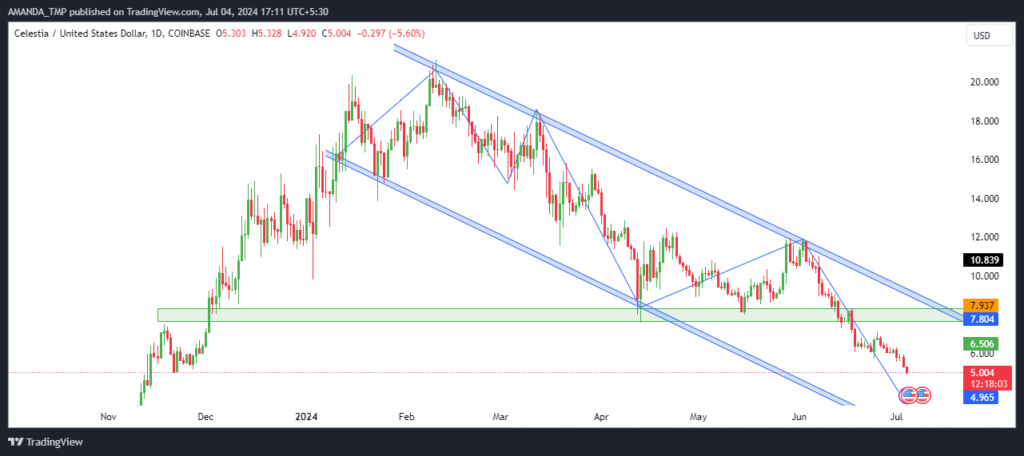
The TIA crypto price underwent profit booking over the last five months. Also, the candlesticks formed on the daily crypto chart were strongly bearish, which indicated a higher probability of a price decline.
TIA/USD Chart by TradingView
TIA declined below the 20,50 and the 200-day EMAs. The EMAs are trading in a death cross. The crypto price declined consistently along with the decline in EMA value.
The MACD and the signal line overlapped, and both metrics traded in the negative territory reflecting weakness and volatility.
The RSI value has been consistently trading below the 30 level for a long time. It shows that the momentum of the price is strongly bearish. It further declined below the 14-day SMA on the daily chart.
TIA Faced Major Bearish Pressure
TIA faced significant bearish pressure, declining 75% from its all-time high. With high volatility (20.78%) and an 11.7% drop in market cap in the last 24 hours, long liquidations dominate.
Technical indicators show bearish trends with falling wedge patterns, death cross EMAs, and RSI below 30, indicating continued downward momentum.
The support levels for the crypto are $1.50 and $2.10, followed by the resistance levels of $11.80 and $15.00.
Disclaimer
This article is for informational purposes only and does not provide any financial, investment, or other advice. The author or any people mentioned in this article are not responsible for any financial loss that may occur from investing in or trading. Please do your research before making any financial decisions.


