

- ANC token price is showing recovery on a daily time frame, and currently, it is trading at $3.5.
- The token moves in a downward parallel channel on a weekly time frame.
- The pair of ANC/BTC is trading at 0.000091 with a decrease of -5.82% in the market cap of the digital asset over the past 24 hours.
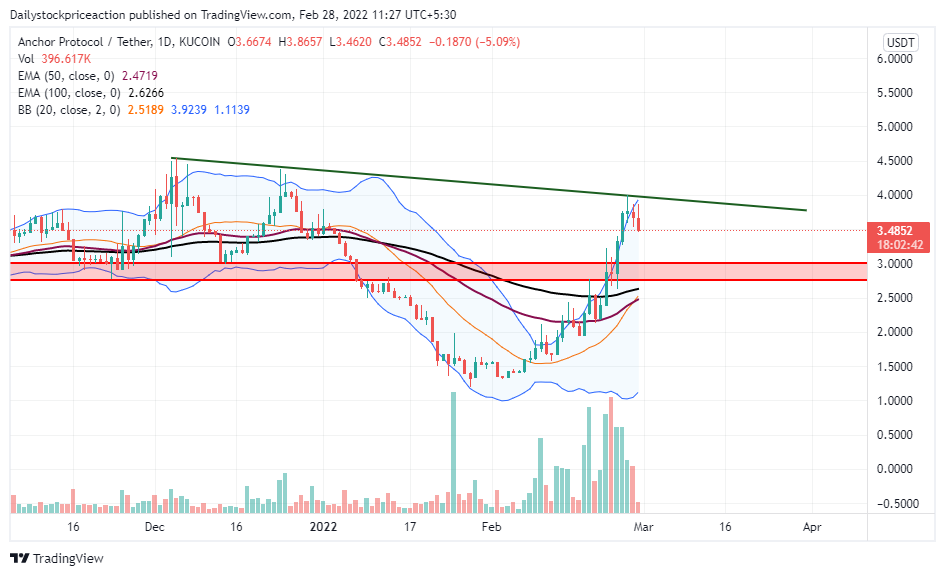
ANC token price is in uptrend from the past trading days, depicting the same on daily time frame. The token price respects the green trendline, and it is facing continuous rejection.ANC token price fell heavily during the previous three weeks, but from the past 2 weeks, the token has recovered and is showing a U-shaped recovery. The token is currently trading above all the important Exponential Moving Average(20,50,100) and breaking it with huge volumes. The ANC token price is trading along with the upper band of the Bollinger band indicator after crossing the 20 EMA. At token showed a sharp impulse move with big bullish candlesticks, and now it can rest at the red supply zone turned demand zone. Volumes have increased after the breakout of all the crucial EMA, and therefore the trend and breakout can be validated. As a result, the momentum can continue for more time.
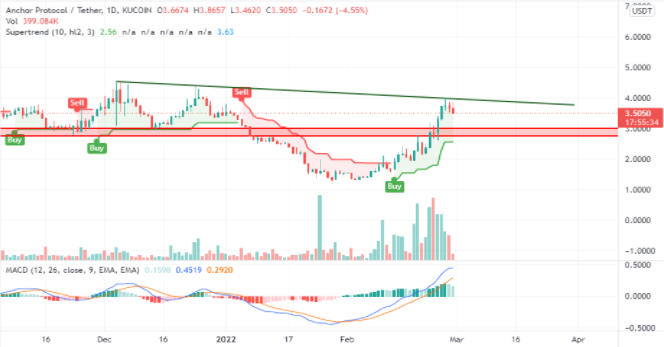
MACD and Supertrend are showing bullish signs on daily time frame
ANC token price is in a strong uptrend, and the technical parameters suggest the same.


Moving Average Convergence Divergence (Bullish): MACD indicates a bullish trend on the daily time frame as it gave a positive crossover. The buyer’s (blue) signal line crossed the seller’s (orange) on the upside. If the token breaks out of the green trendline, it can reach up to $4.5 and above. It is possibly making new highs if the momentum continues.
Supertrend: Recent bearishness in the overall cryptocurrency market has not affected the super trend indicator. The buy signal from the supertrend indicator is still intact. ANC token gave a breakout of the red trendline of the indicator with a big bullish candlestick pattern, which resulted in the indicator giving a buy signal.
ANC token price is trading in a downward parallel channel
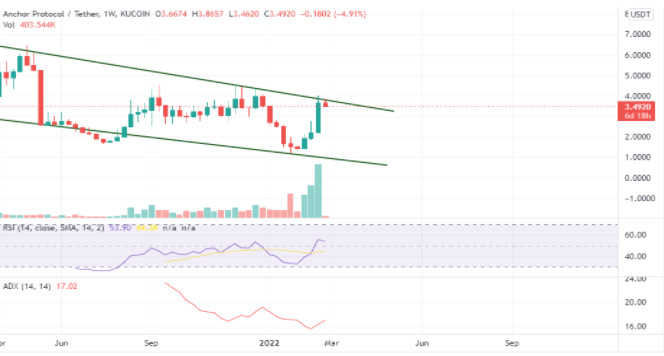
On a larger time frame, ANC token price is still in a downtrend, and the technical parameters suggest the same.
Average Directional Movement Index: ADX has been continuously dipping from the past trading days, and recently, it slipped below 20, as the token faced rejection at $4.10.The ADX curve is still in a downtrend and suggests a further fall in the price of the ANC token if the bull does not take control and break the green trendline.
Relative Strength Indicator: RSI is trading at 53.90 after the token faced rejection and fell. The RSI curve shows a bullish divergence in the weekly time frame. The token price did make new highs recently, but the RSI curve did move above the previous swing high, indicating a bullish momentum for the upcoming trading days in the underlying asset’s price.
Conclusion
ANC token price on a larger time frame and is still in a downtrend, whereas the daily time frame of the token is at making or break level. It remains to see if the bulls charge through the green trendline supply zone of $4.1 and move higher or bears take control and push the price lower.
SUPPORT: $3.0 and $1.5
RESISTANCE: $4.1 and $ 4.5
Disclaimer
The views and opinions stated by the author, or any people named in this article, are for informational ideas only, and they do not establish financial, investment, or other advice. Investing in or trading crypto assets comes with a risk of financial loss.


