
 Bitcoin
 ZKsync
 Pudgy Penguins
 Pearl
Pearl Quantus
 Starknet
 NEAR Protocol
- Arbitrum crypto has witnessed a huge advance in its trading volume.
- The ARB crypto price has traded in green for only 12 days in the last 30 days.
Arbitrum enhances Ethereum with faster, cheaper transactions via the Arbitrum Rollup and AnyTrust protocols.
The ARB token, a governance token for the Arbitrum DAO, allows holders to vote on ecosystem proposals.
Arbitrum’s decentralized governance includes the Security Council, elected by the DAO, ensuring community-driven decision-making.
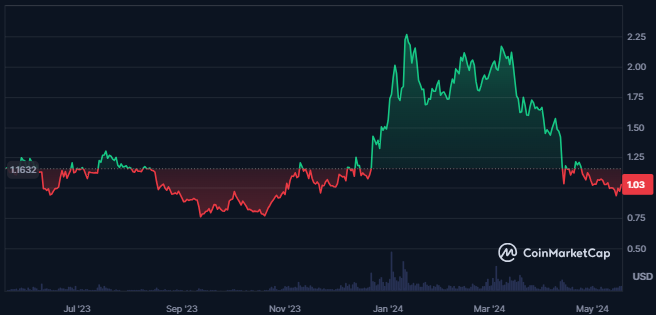
The sentiment of the ARB crypto is bearish, as per CoinCodex, while the fear and greed index of the crypto is at 73, which indicates greed among investors.
The crypto price is highly volatile, resulting in a volatility of 6.5%. The Arbitrum crypto also has a good market cap presence, resulting in 0.11%, followed by a market cap value of $2.723B.
Advances in The Open Interest of Crypto: What Does Derivatives Data Represent?
The derivatives trading volume of Arbitrum Crypto has advanced by 68.5% over the last 24 hours from the time of writing. The open interest of the crypto has also advanced by 14.16% over the last 24 hours.

The following crypto data shows a surge in trading activity. This is further followed by a higher short liquidation of $274.44K, showing buyers’ dominance.
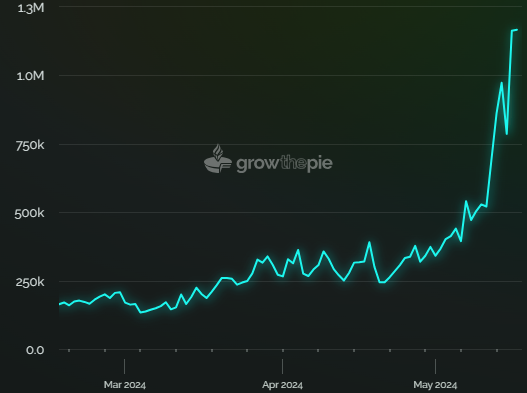
Also, the following chart shows a huge surge of 264% in active addresses for the crypto, followed by an advance of 603% in the last 1 year from press time.
The following metrics behavior shows the rising interest of traders in the Arbitrum crypto.
Do the Technicals of ARB Crypto also Support the Bulls?
The overall chart of the ARB crypto looks strongly bearish, and strong swing lows are formed on the chart, followed by lower low swings.
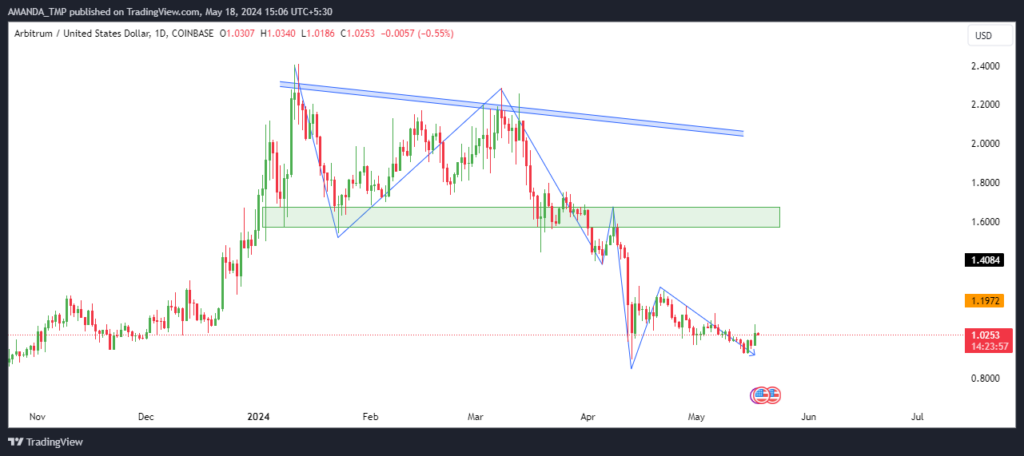
In the most recent price action following the last month, the declining behavior of the ARB crypto has formed a falling wedge pattern. If the crypto price breaks above the following pattern, it might lead to a change in trend, resulting in bullish momentum.
ARB/USD Chart by TradingView
The 50-day and the 200-day EMAs have formed a bearish crossover on the daily crypto chart. The price of the crypto was further traded below the following EMAs. It shows a strong downtrend in crypto.
The MACD on the charts was neutral, and the signal line traded in a bullish cross while the metrics were below the zero level. That represented uncertainty in the crypto trend.
The RSI is trading at a level of 44.4 and has advanced above the 14-day SMA. The following behavior of the RSI also showed uncertainty in the crypto trend.
Summary
Despite a significant surge in active addresses and trading volume, Arbitrum’s (ARB) price remains highly volatile and predominantly bearish, trading only 12 out of the last 30 days in the green.
Technical indicators show mixed signals, with a falling wedge pattern suggesting potential bullish momentum, but overall uncertainty prevails.
If the bearish momentum in the Arbitrum continues, it might hit the levels of $0.500 and $0.7620, while resistance levels for the crypto are $1.5 and $2.20.
Disclaimer
This article is for informational purposes only and does not provide any financial, investment, or other advice. The author or any people mentioned in this article are not responsible for any financial loss that may occur from investing in or trading. Please do your research before making any financial decisions.




