

- Shiba Inu Price is interestingly recovering through a rounding bottom pattern over the daily chart.
- The crypto asset is successfully recovered above 20, 50, 100 and 200-days Daily Moving Average.
- The pair of SHIB/BTC is trading at 0.000000000563 BTC with an intraday gain of 2.06%, whereas the SHIB/ETH pair is CMP at 0.000000007955 ETH with a 24-hour positive change of 1.78%.
Shiba Inu price has successfully recovered throughout March 2022 with a rounding bottom pattern over the daily chart. Basically, the rounding bottom shows the recovery phase as first half showcases sudden decline in price and then from the bottom gradual surge in price can be observed.
SHIB investors can find a U-shaped recovery over the chart which is nothing but a rounding bottom recovery phase of SHIB coin. Price action and volume are both correlated in this scenario and gradual increase and decrease with peaks can be observed over the daily chart.


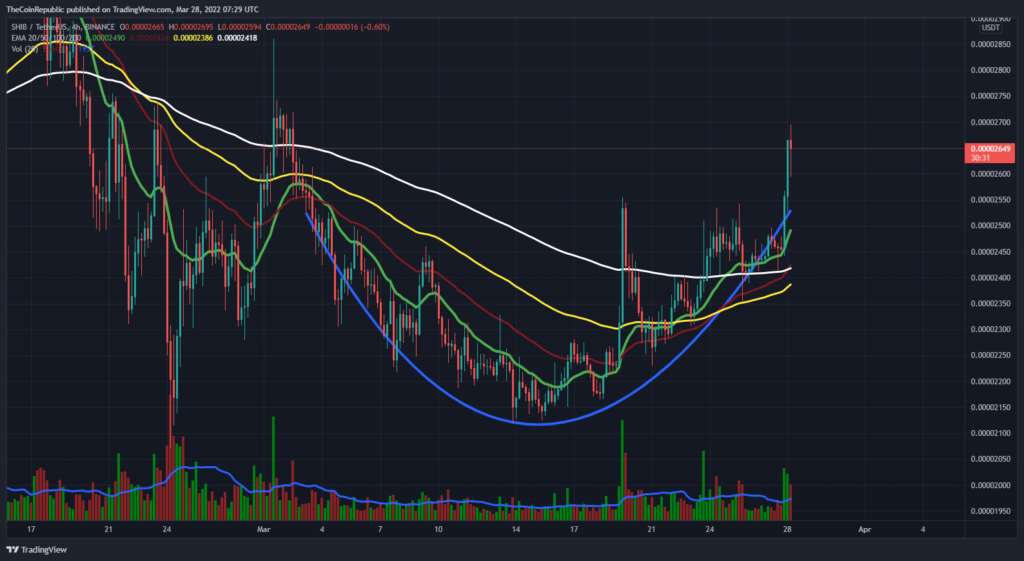
SHIB coin is CMP at $0.00002641 and has significantly gained 7.20% of its market capitalization in the last 24-hour period. Trading Volume has massively increased to 121.49% in the intraday trading session. The highest and lowest hits by SHIB coin are $0.00002695 and $0.00002527 respectively in the last 24-hour period.
SHIB coin accomplishes its benchmark by attracting this much amount of traders or buyers. Simply Trading volume signifies buyers eagerness towards the SHIB coin. Volume change over the chart is above average line which signifies the trading intensity of SHIB coin in the intraday trading session. However, SHIB is experiencing short selling pressure from the start of Monday’s trading session. SHIB bulls must tighten their grip to avoid falling into any kind of bearish trap.
What do Technical Indicators Suggest?
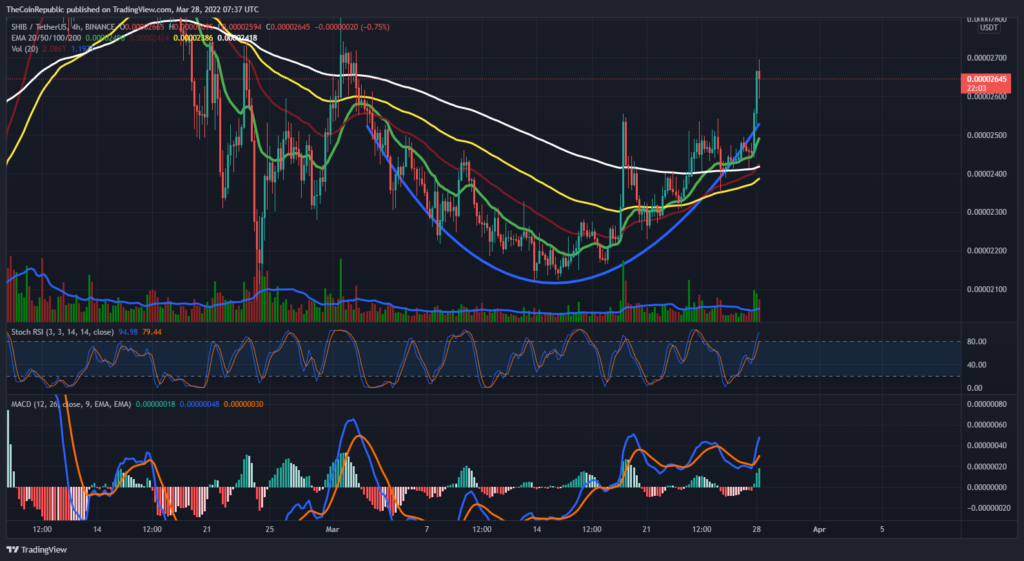
SHIB coin price is experiencing short selling and bears on their way to interrupt the week’s opening session by creating selling pressure over the daily chart. The SHIB coin recovered much better with a rounding bottom recovery phase over the daily chart. The technical analysis confirmed the SHIB coin’s recovery throughout the month.
Stoch-RSI showcase presence of SHIB coin in overbought territory. MACD exhibits the bullish nature of the SHIB coin. MACD line is ahead of signal line after a positive crossover.
Conclusion
The SHIB coin showed a great recovery through a rounding bottom pattern over the daily chart. SHIB bulls need to maintain this momentum and sustain at a higher level.
Disclaimer
The views and opinions stated by the author, or any people named in this article, are for informational ideas only, and they do not establish financial, investment, or other advice. Investing in or trading crypto assets comes with a risk of financial loss.


