

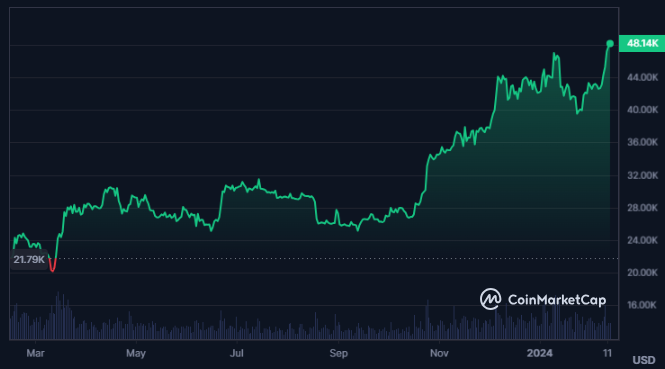
- Bitcoin has given massive returns of 120% to its investors in the last one year.
- The sentiment of the BTC coin is highly bullish as per Coincodex.
Bitcoin, created by Satoshi Nakamoto in 2008, operates on a decentralized peer-to-peer network using blockchain technology. Its limited supply of 21 million coins and controlled inflation contribute to its value.
Bitcoin serves as both a payment method and a store of value, offering transparent transactions and global accessibility to users worldwide.


The TVL of Bitcoin is $841.14M, while the market cap for the same is worth $944.972B, which makes it the world’s largest cryptocurrency. Furthermore, the market cap of the coin has witnessed a decline of 0.33% in the last 24 hours.
The current market price of Bitcoin is $48,147.56 at the time of writing, and the all-time high price hit by the coin is $49,044.77, recorded over two years ago.
Also, the coin’s trading volume has advanced by 5.05% in the last 24 hours, resulting in $193.275B, which is 2.07% of the total market cap of the coin. The circulating supply of the coin is 19.625M BTC.
The traded volume ranking for the coin is 2nd as per CoinMarketCap, and the max supply of the coin is 21.0M BTC. Moreover, the fully diluted market cap of the crypto is $1.010B.
The market cap dominance of the coin is 52.15%, and the volatility of the coin is 4.02%, which means medium. Also, the fear and greed index of the coin is at 70, indicating greed.
Bitcoin Derivatives Analysis
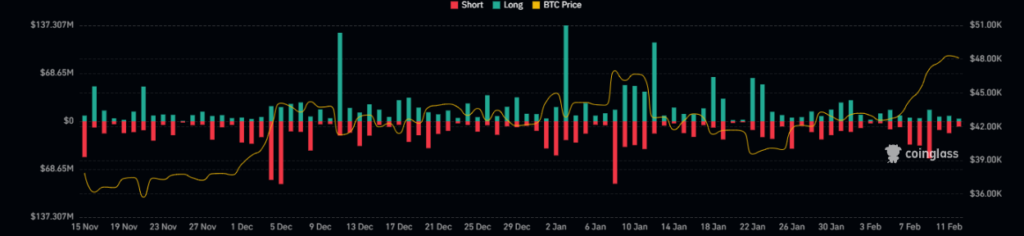
The long/short ratio for Bitcoin is 1.0272, and the value of the derivatives traded volume for the coin in the last 24 hours is $35.03B. The open interest for the coin is also trading with no significant change, while the options volume has declined by 39.73% in the last 24 hours.
The long liquidation and the short liquidation for the crypto are almost the same as per Coinglass, as the long liquidation is worth $11.17M against the short liquidation of $11.79M.
The following derivatives data indicate neutrality in the price and no side of the buyers or sellers winning in the market over the last 24 hours.
BTC Crypto Technical Analysis
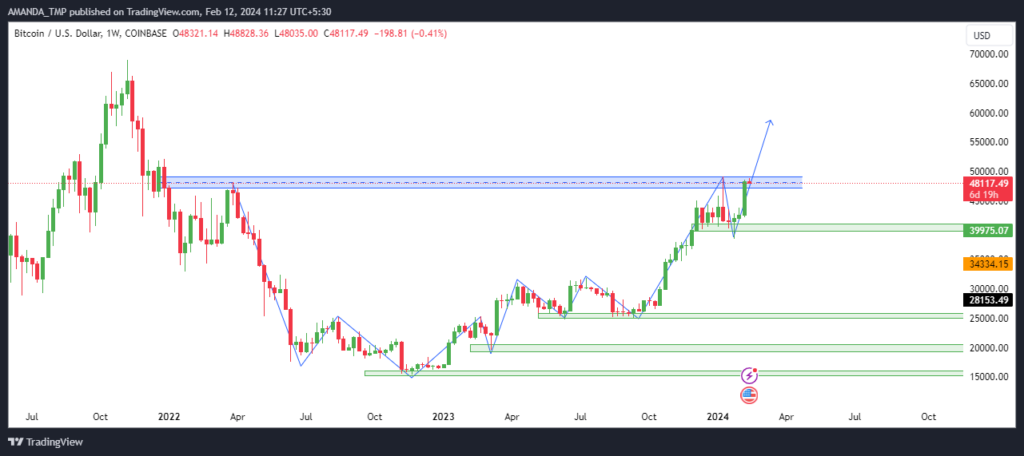
The BTC price chart consistently forms higher high swings, indicating the bullish sentiment and buyers’ dominance in the market. The price of the BTC crypto has advanced by more than 18% from the most recent swing low.
The price of the coin has currently hit the most crucial resistance level, and if it breaks above the resistance level, a further surge in the price might be seen.
BTC/USD Chart by TradingView
The 20, 50, and 200-day EMA are trading in a golden cross, and the value of the EMAs is consistently advancing with the advance in the crypto price. The following behavior of the indicators represents a strong advancing uptrend.
The MACD also gives a strong buy signal as the MACD line is trading above the signal line. Also, both the lines are trading above the zero level, followed by the formation of strong bullish histograms.
The RSI is currently trading at a level of 73.17, which indicates an overbought area followed by the value advancing above the 14-day SMA. It represents a strong bullish momentum in the price of the crypto.
Summary
Bitcoin exhibits a highly bullish sentiment with a 120% one-year return and a current price surge nearing its all-time high. Technical analysis reveals consistent higher highs, supported by bullish EMAs, MACD signals, and RSI momentum, indicating a strong advancing uptrend.
Disclaimer
This article is for informational purposes only and does not provide any financial, investment, or other advice. The author or any people mentioned in this article are not responsible for any financial loss that may occur from investing in or trading. Please do your research before making any financial decisions.


