
- The BTC crypto price dropped 0.85% during the weekly trading session.
- Oscillators are bearish about the current price, while the moving averages show bullish signals.
- An increase of 20.73% has been observed in the Bitcoin volume in the last 24 hours.
Bitcoin (BTC) is the first ever built open-source decentralized blockchain network. It secures its network and validates transactions using a proof-of-work (PoW) consensus algorithm. BTC is a peer-to-peer online currency where transactions happen directly between equal participants.
The BTC crypto has shown enormous returns since it suffered heavy falls until December 2022. However, crypto once again came back to the limelight and is creating new heights.


Buyers are Approaching Bitcoin: Will It Lead to a New All-time High?
The Bitcoin price started a major bullish reversal in January 2023. However, a significant change in price occurred in February 2024, which completely shifted the market sentiments towards bullishness. That shift happened on the investor level rather than the regular traders’ levels.
As a consequence, the BTC crypto price experienced a new all-time high mark of $73,750.07 on March 14, 2024. However, the price faced a bullish correction phase afterward. The Bitcoin price is currently recovering from that correction phase. The buyers are engaging in the current sessions.
Price to Volume and Social Dominance Analysis
BTC social tweet upsurges peaked in mid-April 2024, resulting in 30% dominance in the entire crypto world. However, the price before the social dominance peak showed positive growth.
However, after the peak of social sentiments, the price reflected adverse remarks, resulting in the deflecting interest. Since May 2024, the price has been rising. Yet, its social dominance is declining, reflecting the fading influence of social tweets.
Technical Analysis of the Bitcoin (BTC/USD)
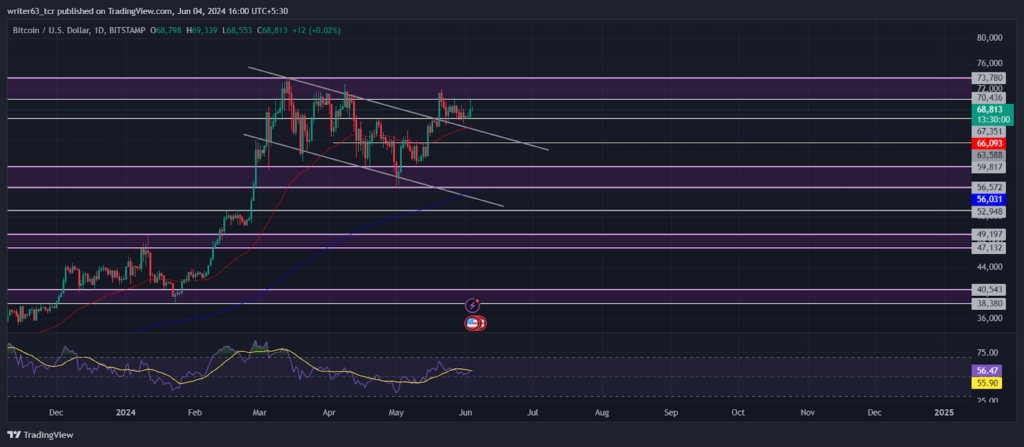
The long-term bullish outlook has been reflected above the key exponential moving averages (EMAs). BTC price has rebounded from the 50-day EMA from below, which is an indication of an uptrend continuation.
The Bitcoin price has given a breakout from a major bullish flag pattern at $67,351. Earlier, the buyers started the bullish rally from the $56,572 decisional demand zone, resulting in the breakout. The price reflected an almost 7% rise after the breakout. The price formed several bullish candles in the last four trading sessions, reflecting the buyers’ presence.
The relative strength index (RSI) is showing an internal bearish divergence in the current price momentum. It indicates the price is facing selling pressure in the current session. The RSI is moving at 56.88 above the SMA line.
Summary
The Bitcoin price has ended the bullish correction period, which was created in the form of a bullish flag pattern. The cryptocurrency is reflecting an over 20% bullish rally from the $56,572 decisional demand zone. The current market situation of the BTC reflects a bullish outlook. However, it can be bearish if the price slips below the $59,817 demand zone.
Technical Levels
The immediate resistance for BTC was $73,780 at the time of writing, while the $59,817 level was the next support. The price may be more likely to create a new all-time high rather than slipping downward.
Disclaimer
The views and opinions stated by the author or any people named in this article are for informational purposes only. They do not establish financial, investment, or any other advice. Investing in or trading crypto or stock comes with a risk of financial loss.


