
- Toncoin has outperformed 78% of the top 100 crypto assets in the last 1 year.
- In the last 30 days, the price of TON has traded in green for 15 days.
The Open Network (TON) is a decentralized blockchain platform created by the Telegram team. Through sharding, it supports millions of transactions per second and includes components like TON Blockchain, TON DNS, and TON Storage for various decentralized services.
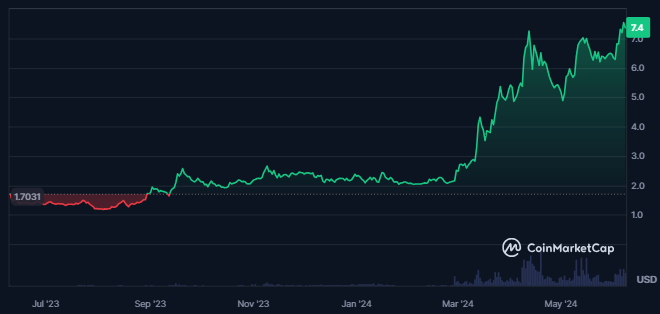
Price Overview Chart of TON | Source: CoinMarketCap


The total value locked for the TON crypto has advanced to $441.84M over the last few days, followed by a surge in the crypto market cap. Further ahead, the stablecoins market cap of the crypto has advanced to $396.09M.
The Toncoin market cap has witnessed a slight decline of 1.8% in the last 24 hours from the spot time, and the traded volume value for the crypto has not seen any significant change.
The following price and volume behavior shows that the investors and traders have not shown any significant interest in the crypto over the last 24 hours. Moreover, crypto’s volume/market cap ratio is 2.17%, which shows medium liquidity.
Toncoin Crypto Derivatives Data Analysis
The Toncoin crypto has witnessed a huge long liquidation of $1.31M, against which the short liquidation is just $102.64K. The total resulting liquidation for the crypto in the last 24 hours from the press time is worth $1.41M.
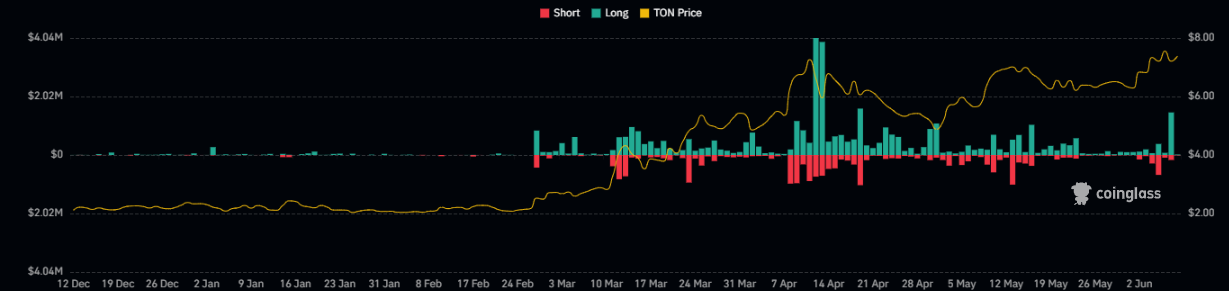
Toncoin Crypto Derivatives Liquidation Chart | Source: Coinglass
The derivatives trading volume for Toincoin has advanced by 13% in the last 24 hours, showing a surge in traders’ crypto activity. Despite the surge in derivatives volume, the open interest in crypto has declined by 11%.
The crypto liquidation further shows bears’ dominance over the last 24 hours.
TON Crypto Technical Analysis
Over the last 24 hours from the press time, a bearish candle on the daily chart of the crypto has formed. Despite this, the crypto price is taking support at a crucial breakout level.
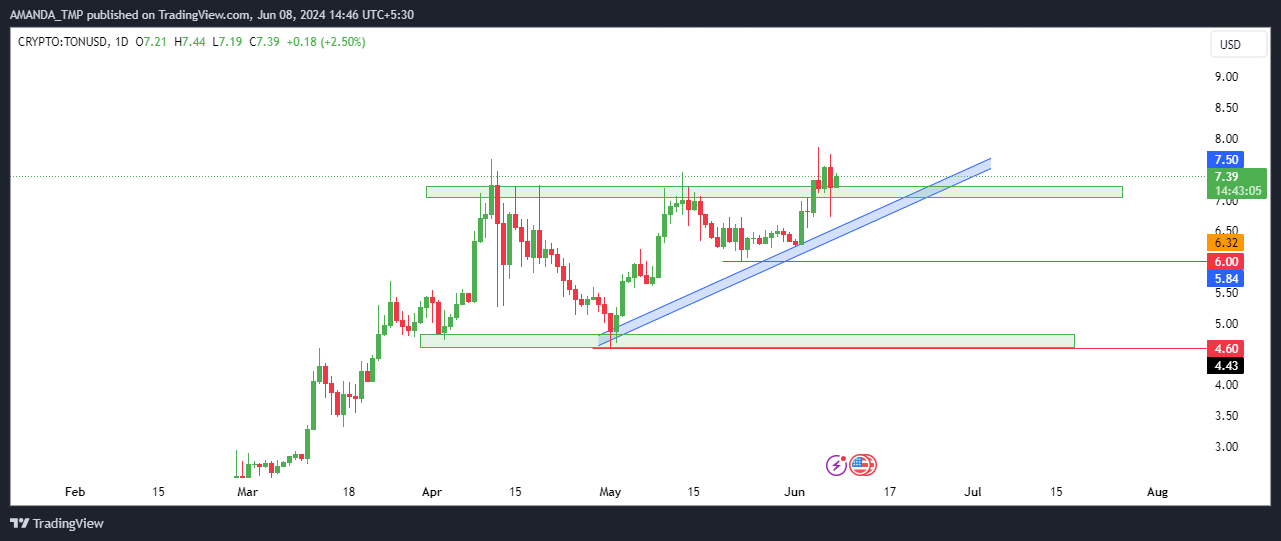
TON Crypto Daily Price Chart | Source: TradingView
The trading price of the TON crypto has broken above the crucial swing high followed by all-time highs, and the price is at press time sustaining above the breakout levels.
If the crypto price further pushes above the previous swing high, a surge with strong momentum in the crypto might be witnessed.’
TON/USD Chart by TradingView.com
The 50-day and the 200-day EMAs exhibit a bullish character as the crypto price is trading above the EMAs and is leading towards higher levels.
The price of the TON crypto further has broken on the higher side of the Bollinger band, which shows a bullish breakout and buyers’ dominance in the crypto price.
The MACD has further broken above the median level and is trading in a bullish cross of the MACD and the signal line. The histograms on the charts also support the bullish outlook.
The RSI has also broken above the 14-day SMA and is trading at a level of 63.2 at press time. This shows a bullish momentum in the trading price of the crypto.
Summary
Toncoin (TON) has shown a bullish breakout, advancing above key levels with strong buyer dominance.
Despite a slight decline in market cap, trading activity remains high, with a notable increase in derivatives volume. Technical indicators, including MACD and RSI, support continued bullish momentum, suggesting further potential for price surges.
The support levels for the TON crypto are $4.6 and 6.0, followed by the resistance levels of $10.0 and $12.0.
Disclaimer
This article is for informational purposes only and does not provide any financial, investment, or other advice. The author or any people mentioned in this article are not responsible for any financial loss that may occur from investing in or trading. Please do your research before making any financial decisions.


