

- Siacoin price action looks rangebound between support and resistance on the chart
- The 24-hour trading volume is at $63 Million
- SC/BTC pair is trading neutral by 1.0% at 0.00000032 BTC
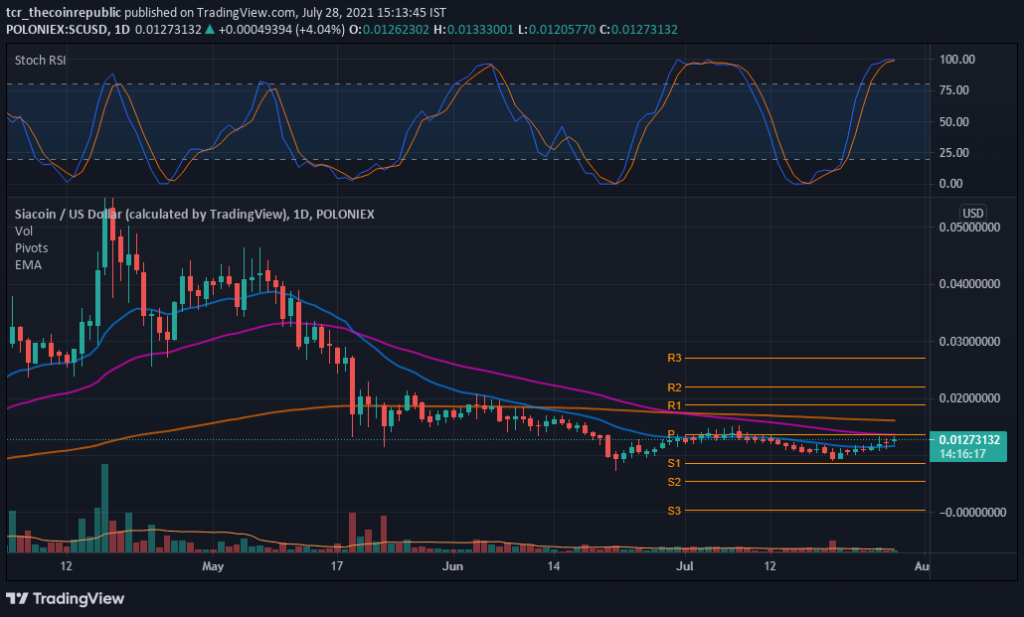
The daily technical chart of Siacoin projects a bullish trend. According to Pivot points (FIB), SC’s crucial support level is $0.00861393. Conversely, if it moves up, the necessary resistance level to observe is at $0.01366324. Thus, while the intraday chart forms a Doji star candlestick pattern, predicting prices are in a sideways trend with high dependability.
The exponential moving average (EMA) composed of 20,50,200-EMA can be a reliable support for currency price changes. However, investors can observe a death crossover of 50-200 EMA, and the price is below the orange line, ensuring a downward trend of SC price until it stays below 200-EMA.


The volume of (2.155M) is beneath the MA of 20-days (5.869M). selling pressure is low in SC, making its price remain around the resistance zone. Investors may also observe diminishing volume bars in the chart, which indicates a big move is expected in upcoming trading sessions.
The Stochastic RSI (overbought) with a value of K-100 D-99 presents a buy signal in the coin. Investors may observe an inclining slant and a negative crossover in the index. It may remain in positive territory for future trading sessions.
Siacoin (SC) Price Trend Requires High Buying Volume to Break Above 50-EMA
Siacoin price is at $0.01278283, with a daily gain of 7.3% and a weekly gain of 30.3%. In addition, the price is rangebound between support and resistance areas for the past few months. The Stochastic RSI indicator shows a buy signal, and the traders have guided low selling pressure. Technically, the price is showing minor signs of positivity, and it may get rejected by 50-EMA, which will lead prices to drop further. Therefore, as with overall market sentiment, the trend remains bearish.
Resistance Level: $0.01366324
Support Level: $0.00861393


