
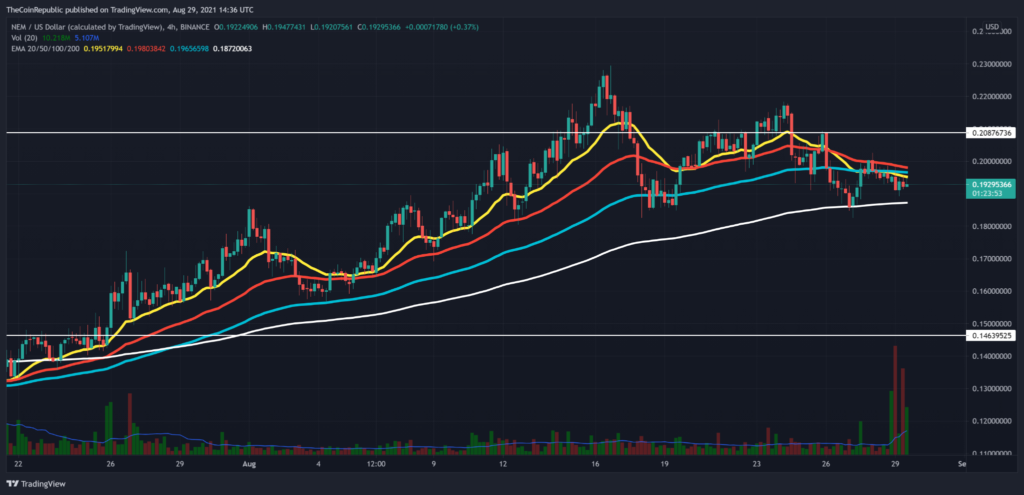
- XEM token price struggles to rise above the $0.20 mark despite a false breakout.
- The opposition from the 200-day EMA hinders bullish growth in the XEM.
- The token pair XEM/BTC trades at 0.000004014 BTC with an intraday gain of +0.44%.

The XEM token prices move sideways as it struggles to rise above the $0.20 horizontal level. The recent breakout of the resistance trendline following a successful retest has failed to start a bullish rally.
The token price is trading above the 20-day EMA but struggles to rise above the solid opposition of the 20-days EMA. Moreover, the EMAs are in a bearish alignment reflecting strong underlying bearishness.


The volume (3.759M) is below the MA of 20 days (11.89M). The price is moving around the resistance area because of the moderate volume in XEM. Investors might also notice that volume bars are decreasing on the chart, which indicates that volatility will be a factor in the next trading session.
MACD indicators indicate a bullish crossover above Jun 29 signal line, a buy signal for the coin. Investors can also see tiny green bars in the Histogram index.
Presently, the XEM token is trading at $0.1941, with a fall of -0.09% in the market capital. In addition, the trading volume of XEM tokens has decreased by 3.60% in the past 24 hours, projecting a rise in the number of XEM token sellers.
XEM Token Faces The Formidable Resistance.
The daily technical chart for the XEM coin indicates an upward trend. The pivot levels indicate that the primary support level for the upward trend is $0.15. If it accelerates up, the resistance level is $0.27. The chart shows a Doji candlestick pattern, but the price may remain sideways with medium reliability.
The relative strength indicator (Bullish) indicates a rising bullish sentiment for XEM token price as the slope of RSI spikes up.
The ADX indicator signals a fall in trend momentum as the price struggles near the $0.20 mark.
Conclusion: XEM Token price is standing at a crucial crossroad as the bulls attempt to rise above the $0.20 horizontal level. Investors hoping for a bullish rally after the trendline breakout might find their dream come true if the price rises and sustains above the latest resistance level.
Support: $0.15 and $0.12
Resistance-$0.20 and $0.25


