

- Ethereum crypto price is currently trading below the significant EMAs.
- The price of the ETH crypto is declining with slow momentum, signaling a possibility of a reversal in price.
Ethereum is a decentralized blockchain platform enabling smart contracts and dApps. Its native currency, Ether (ETH), fuels transactions and holds value as a store of digital assets.
As per Coincodex, the sentiment of the Ethereum crypto is bearish, and following the technical charts, it further forms lower lows on the daily chart. The crypto market cap has also declined by 5.5% in the last 24 hours.


Traders’ engagement can also be witnessed as the traded volume for the crypto has advanced by 31% in the last 24 hours. This further results in a traded value of $18.033B, which is 4.93% of its market cap.
Blockchain Data Overview
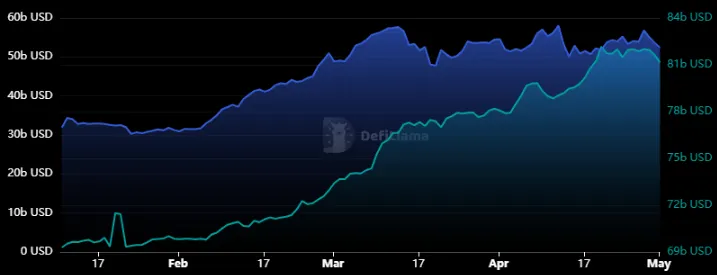
Although the price of the ETH crypto is declining, the stablecoins market cap and the Total Value Locked for the crypto consistently rose at the time of writing.
The following behavior of the Blockchain metrics shows further potential in the crypto as increased adoption and demand can be seen through the given data.
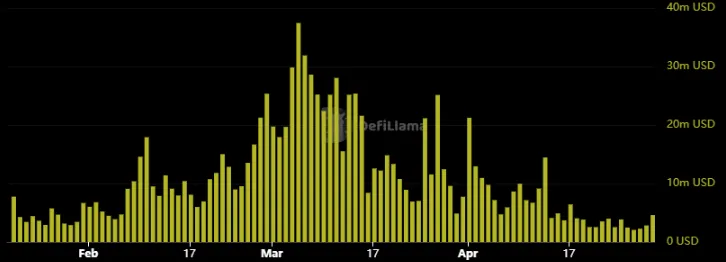
Despite the stablecoins market cap advance, crypto revenue can decline over time. It could be due to a drop in transaction fees or decreased demand.
The two of the following metrics of the Blockchain clash. Thus, looking at the technical charts can be more helpful in predicting the price of the ETH crypto.
ETH Crypto Technical Analysis
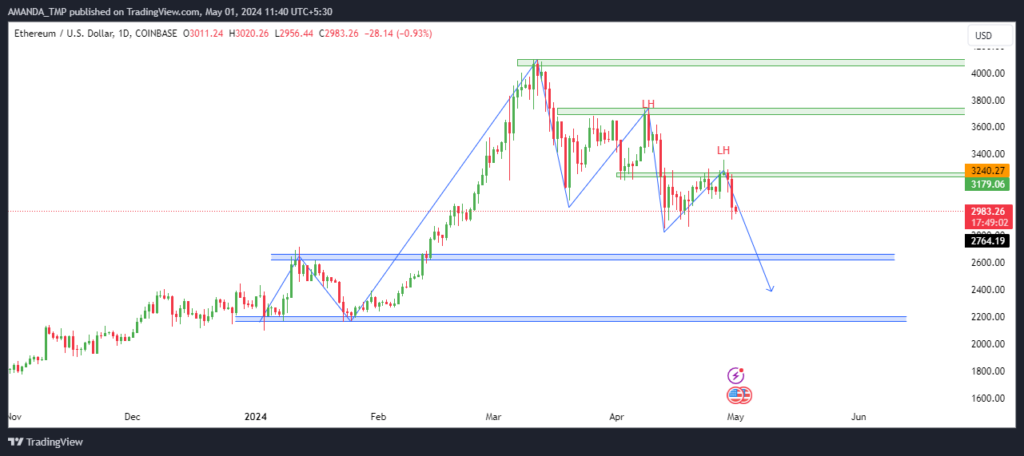
ETH crypto formed a swing low of $2169.47 on the 25th of January. The price later broke above the swing high of $2717.89 and advanced by 50% since the breakout.
The crypto formed a new swing high of $4093.88 and then started to witness profit booking from the same level. The price has declined by 25% since then and is trading at $2981 at the time of writing.
The price of the ETH took only 46 days to advance to the swing of $4093.88 but has been declining for the last 50 days and is still trading above 50% of the bull run.
The following behavior of the price and time indicates buyers’ dominance and a higher probability of change in the crypto trend to bullish.
ETH/USD Chart by TradingView
The Fibonacci chart of the ETH crypto further shows that the price has increased to 61.80%. The price is further being supported simultaneously, and the 200-day EMA is also approaching the same.
A zone between the level of 61.80% and the 200-day EMA can be considered a buyer’s opportunity zone. The price of the ETH crypto further forms any bullish candlestick pattern, and the price might lead to the previous swing high of $4090.
Summary
Despite Ethereum’s declining price and bearish sentiment, increased trader engagement and rising stablecoin market cap indicate potential demand. Technical analysis suggests a bullish reversal, with the price retracing to crucial Fibonacci levels and approaching the 200-day EMA. A bounce from this zone could lead to a retest of previous highs.
Technical Levels:
- Support levels: $2093 and $2725
- Resistance levels: $3350 and $3750
Disclaimer
This article is for informational purposes only and does not provide any financial, investment, or other advice. The author or any people mentioned in this article are not responsible for any financial loss that may occur from investing in or trading. Please do your research before making any financial decisions.


