

- FTM Token price jumps more than 80% in the past week.
- The daily EMAs rise higher in a bullish alignment, projecting a rise in underlying bullish sentiments.
- The FTM/BTC is trading at 0.00001611 BTC with an intraday gain of +7.41%.
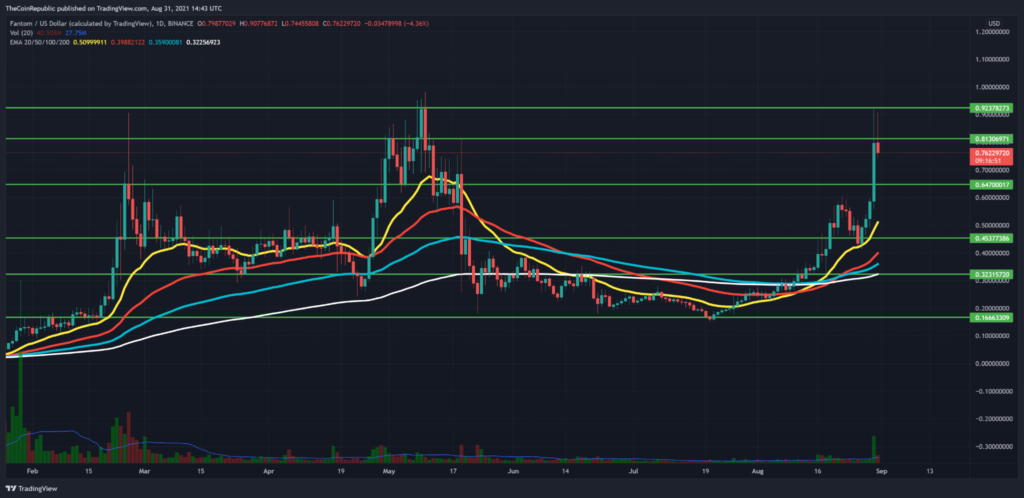
FTM coin price breaks out of the inverted head and shoulder pattern with a boost in daily volume. The price action shatters various key resistance levels in the daily chart.
The token price trades highly above the 20-day EMA while all the other EMAs rise higher in a bullish alignment with the increased buying pressure. Thus, investors may find the EMAs acting as solid support levels in case of a bearish reversal.


The Token price at the press time is $0.7639. However, the market cap decreased by 7.53% over the past 24 hours. It means that prices are retracing after the bullish boost.
FTM Token In The 4-hour Chart
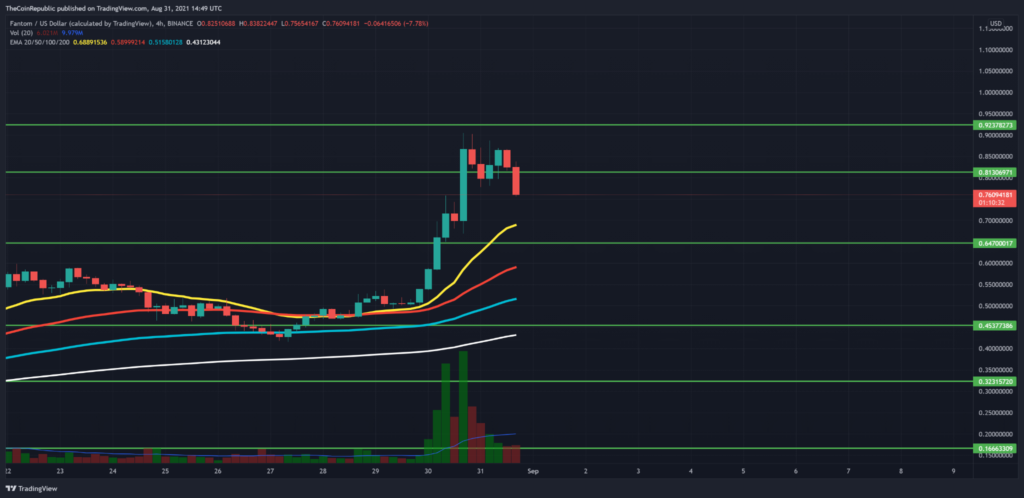
FTM token price falls out of a double bottom pattern in the 4-hour timeframe that may briefly result in a pullback to the 20-period EMA.
As per price action, the support levels for the token is residing at $0.64 and $0.50 marks. In the case of a bullish reversal from any support level, bulls may find resistance at $0.80 or $0.92.
The EMAs in the 4-hour technical chart rise higher in a bullish arrangement with a positive slope that may quickly support the falling token price.
The RSI indicator forecasts a surge in underlying bullish predilections as to the slope of RSI spikes higher.
The ADX indicator proposes a rise in trend momentum.
Conclusion – The FTM token price climbs higher with the assistance of the bullish exponential moving averages. Investors may find entry spots near the dips on the 20-period EMA.
Support – $0.64 and $0.50
Resistance – $0.80 and $0.92


