

- For the daily SAND token chart, the RSI value has reached the overbought zone
- The SAND/BTC pair traded for 0.0000421 BTC with a gain of 29.3%
- The daily trading volume for The SAND token is $7.06 Billion, indicating a 64.6% hike
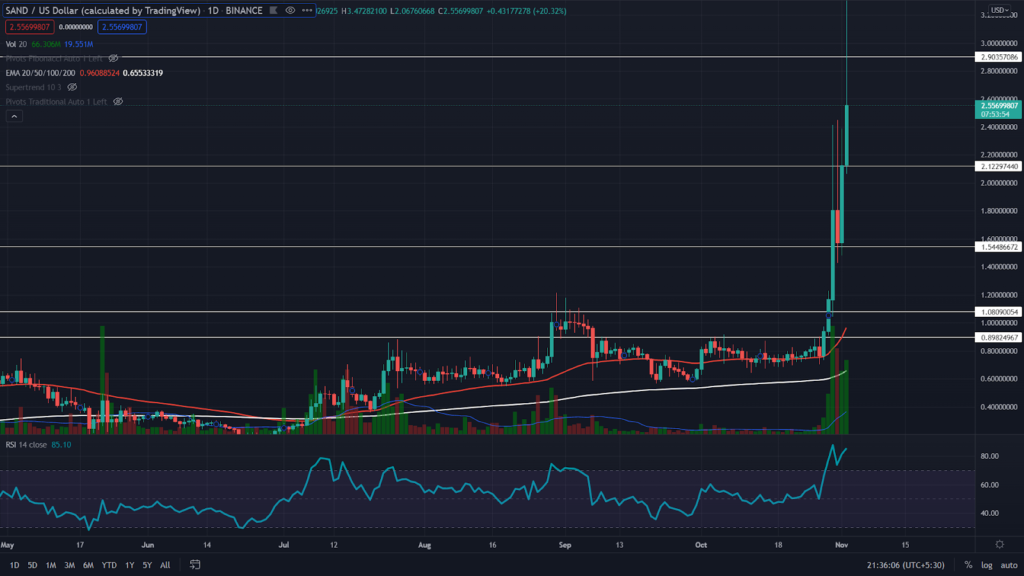
The SAND token price indicated an excellent long opportunity for crypto traders when the price gave a decisive breakout from the $1.08 neckline of a rounding bottom pattern. The token price managed to provide proper retest to this level and initiated a significant movement in its chart. So far, this rally has marked the new All-Time High at $3.27.
About the EMAs: The SAND token’s price is trading above the crucial EMA’s of 20, 50, 100, and 200, indicating a solid uptrend in this token.


The RSI value at 85 indicates a strong bullish sentiment within the SAND token. However, it also projects the token has entered the overbought region.
The SAND Token Chart Shows A Tweezer Top Candle PatternAt The $2.9 Mark.
Source: SAND/USD chart by Tradingview
As for today, the SAND token is experiencing sufficient selling pressure from the $2.9 resistance, indicating a Tweezer top candle pattern in the 4-hour time frame chart. The token price also shows a good follow-up candle, suggesting the price could enter into a minor retracement phase. The current price of the SAND token is $2.5, with an intraday gain of 21.96%
As per the traditional pivot levels, the nearest resistance for the SAND price is $3.3, followed by 4.18. And for the opposite side, the crypto trader can expect the nearest support level at $2.45, followed by the $1.54 mark.
Conclusion: From a technical perspective, the SAND token price showed a remarkable rally in its chart, indicating a strong uptrend. However, as mentioned above, the coin could enter into a minor retracement phase, and therefore, the crypto traders can mark the significant support levels in this chart that can help the price to continue its rally.
Support – $2.45
Resistance $2.9


