

- The SAND coin is on an upward trend of 17.7% during the intraday trading session.
- The 24-hour trading volume is at $2,185 Billion.
- SAND/BTC pair is trading positive by 19.1% at 0.00002232 BTC.
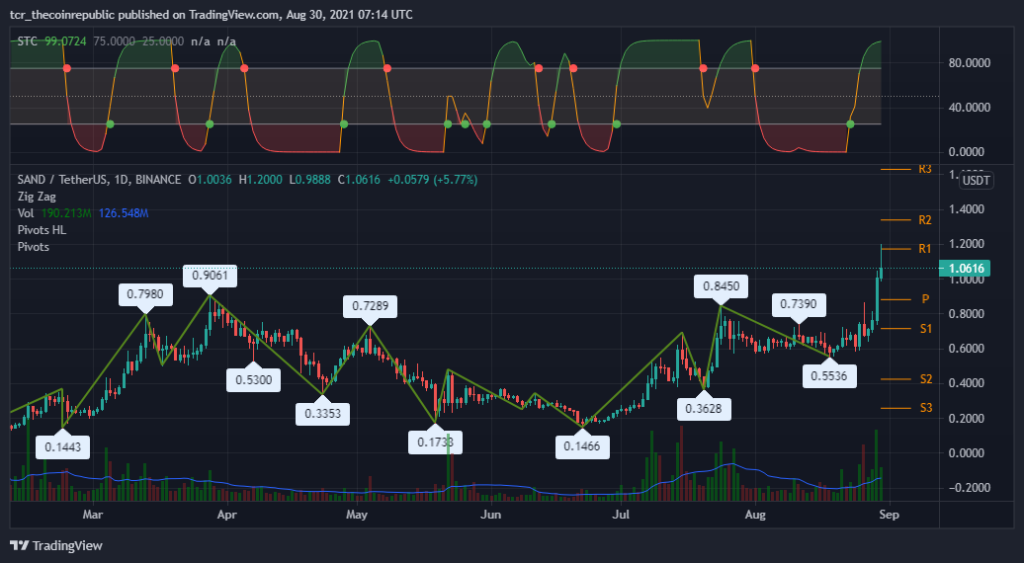
The daily technical chart and price action of SAND coin display an upward trend. According to the pivot levels, the primary support level is $0.88. On the other side, if it rushes up, the resistance level to follow is $1.35. Although the chart forms an inverted hammer candlestick pattern within the day, it is predicted that the price may remain upwards with medium reliability.
The Zig-Zag framed a low of $0.14 on June 22. After that, investors can notice a massive pump of 732%, all the way up to $1.19. The price levels have framed a new all-time high this week.


The volume of (191.553M) is above the MA of 20-days (126.616M). As a result, the volume is high, causing its price to break above the resistance zones. Investors may also mark that the volume bars on the chart are inclining, which intimates that notable volatility is expected in the upcoming trading session.
The Schaff Trend Cycle indicator (bullish) with a 99 represents a buy signal in the coin, projecting an uptrend. Additionally, Investors can see a green buy signal and an upward curve on the index.
The Sandbox (SAND) Coin Bulls Are Heavily Maintaining The Momentum
The price of Sandbox today is $1.07, and the 24-hour trading volume is $2,185,642,554. The price of SAND has risen by 17.7% in the past 24 hours. The circulation of SAND coins is 890 million, with a total of 3 billion. The STC indicator shows a buy signal, and the traders have guided high volume. Technically, the price breaks above the resistance zone and remains in an upward trend. Therefore, as with overall market sentiment, the trend remains bullish in upcoming trading sessions.
Resistance Level: $1.35
Support Level: $0.88


