

- The LRC token price breaks above the 55-EMA during intraday.
- The 24-hour trading volume is at $73 million.
- LRC/BTC pair is trading positive by 34% at 0.00003142 BTC.
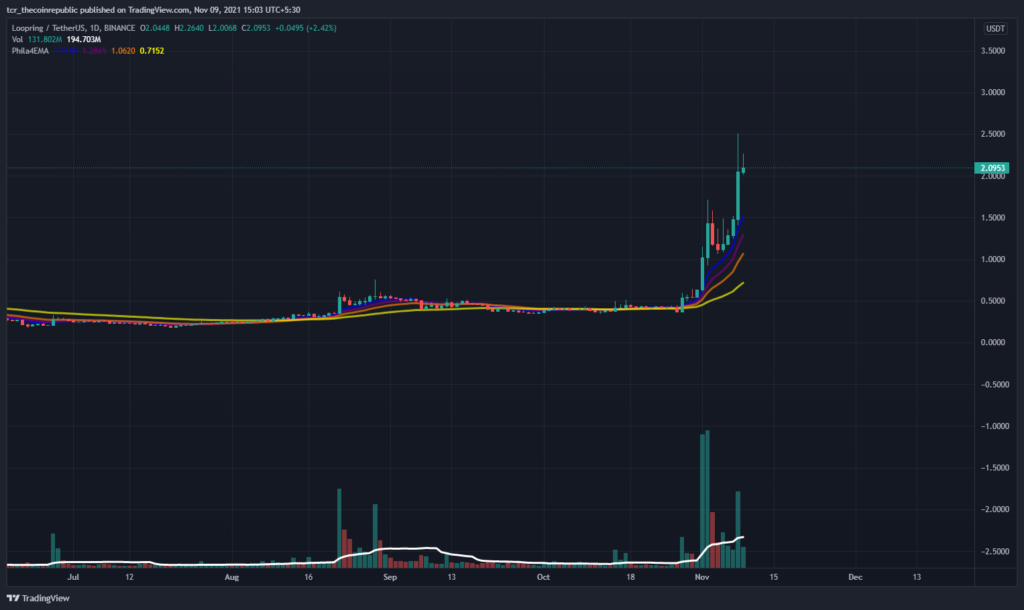
Moving Average (EMA) In the LRC token daily price chart containing 8,13,21,55 EMA, it is reliable support for currency price movements. Investors can find that price moves above the yellow line and guarantee an uptrend for Loopring as long as prices are above the moving average.
The volume (132.237 M) is close to the 20-day moving average (194.725 M). The volume is moderate, so the cost is moving upside. Investors may also notice an increment in volume. This indicates that unusual changes are normal on the following trading days.


LRC Token Price Getting Closer Near The ATH
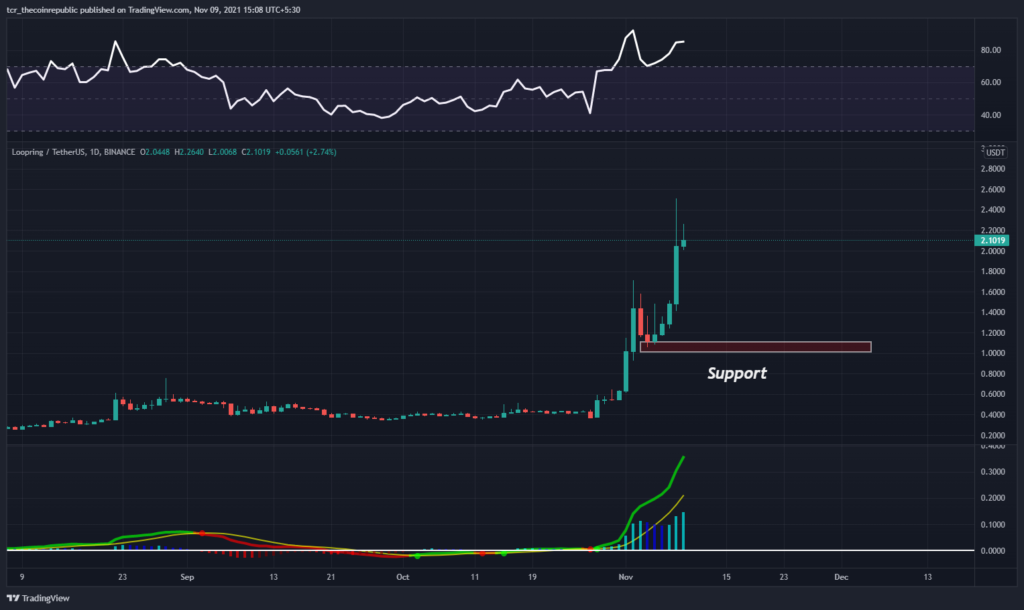
The daily price chart of LRC token is on the rise. Depending on the price movement, the support range is between $1.0. Hence the token has given a parabolic move resistance level cant be predicted in the current scenario.
The RSI showed a signal of 85 (Overbought) with a short-term buy forecast. Investors may find that the indicator’s RSI line is sloping upwards. A fall can happen on future trading days.
The MACD shows a (bullish) cross above the signal line on October 28, indicating a buy signal for the currency. In addition, investors can see massive green bars in the histogram indicator.
Conclusion
Loopring’s price today is $2.14 with a 24-hour trading volume of $4,452,300,236. LRC prices have increased 37.8% in the past 24 hours. It has a LRC supply of 1.2 billion and a total supply of 1.37 billion.
RSI and MACD indicate a buy signal. Traders have directed high volume. In fact, the cost is gradually moving towards the resistance zone. A market overview also shows that this pattern will continue to surge in the coming trading days.
Support Level: $1.0


