

- The XEC coin price manages to stay above the several EMA’s during intraday.
- The 24-hour trading volume is at $158 million.
- XEC/BTC pair is trading negative by -3.0%.

Moving Average (EMA) In the XEC coin daily price chart containing 8,13,21,55 EMA, it is a reliable support for currency price movements. Investors can find that price moves above the yellow line and guarantee an XEC uptrend as long as prices are above the moving average.
The volume (5.535 B) is below the 20-day moving average (35.819 B). The volume is low, so the cost is struggling for several days. Investors may also mark a decrease in volume. This indicates that unusual changes are normal on the following trading days.


XEC Coin Price Hits The Resistance and Now Moving Downwards Gradually
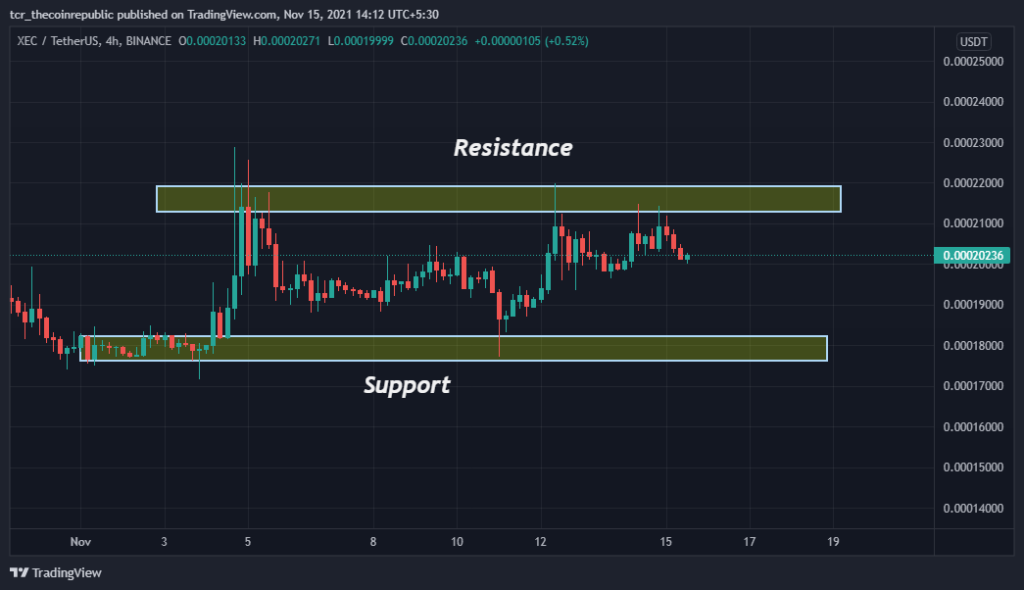
The daily price chart of the XEC coin got rejected from the resistance zones. Depending on the price action, the support area is within $0.00018. On the flip side, the resistance range to look for is around $0.00022.
The RSI showed a signal of 50 (neutral) with a short-term flat sign. Investors may find that the indicator’s RSI line is running flat. A plunge can happen on future trading days.
The MACD shows a (bearish) cross below the signal line on November 15, indicating a sell signal for the currency. In addition, investors can see red bars in the histogram indicator.
Conclusion
The price of eCash today is $0.00020408 with a 24-hour trading volume of $158,454,696. XEC prices have fallen -1.5% in the last 24 hours. Its current supply is 19 trillion XEC, and the total supply is 21 trillion.
RSI shows a neutral sign, and MACD indicates a sell signal. Traders have directed low volume. In fact, the cost got rejected from the resistance zone. A market overview also shows that this pattern will continue to plunge in the coming trading days.
Resistance Level: $0.00022
Support Level: $0.00018


