

- EGLD showed rejection near 20 day EMA.
- Bulls are hopeless now, showing exhaustion.
EGLD ( MultiversX) token is now below the neutral marks of $40, showing a gradual down move. However, the chart shows a falling wedge pattern which suggests an upside move toward the trajectory of $45. The primary support of $32 is the demand zone when any down move happens, and then these levels react as a place to pause and reversal place.
EGLD token hovers near the congestion zone and the uncharted territory, and now picture-perfect moves can be seen above the marks of $2.50. A much-awaited breakout is yet to register, and the investors now do all the formalities, and now the move depends on the shivering bulls.


When writing, the EGLD token is trading at $37.44 with an intraday drop of 3.33%, showing a short buildup by sellers. Moreover, the trading volume also dropped by
2.22% showing lower interest of investors.
Daily Charts Formation of EGLD
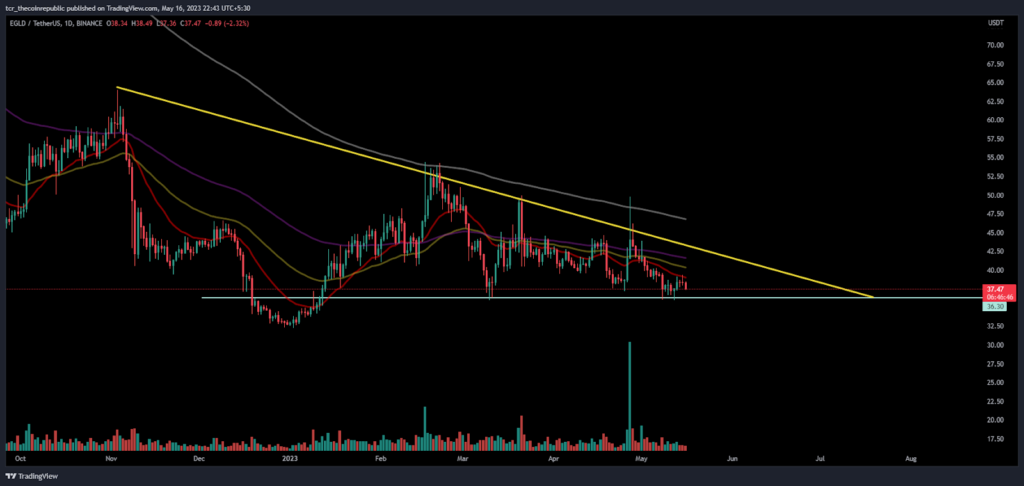
On the daily chart, the EGLD token shows a long wick rejection from $50, showing rejection from the supply range. A robust and decisive breakout must capture the ridge again, as a solid bearish range was there, and sellers maintained the grips there.
However, price action shows a weaker momentum and a rise in volatility. Moreover, the daily chart delivers a double bottom structure suggesting that the token is near the immediate support where a bounce can be expected.
EGLD token is sharply rejected from the upside marks near the supply marks of $40, where sellers maintained the grips.
The battle is exciting: beat the overwhelmed bears and escape the range with sparkles. The token trades below the 20-day moving averages and the Bollinger band’s middle.
MultiversX token bounced from the lower Bollinger band and held the range near $37, which was to be watched. However, the price is below the neutral levels of 23.6% and showing long unwinding.
Short Term Charts Shows Sellers Dominance
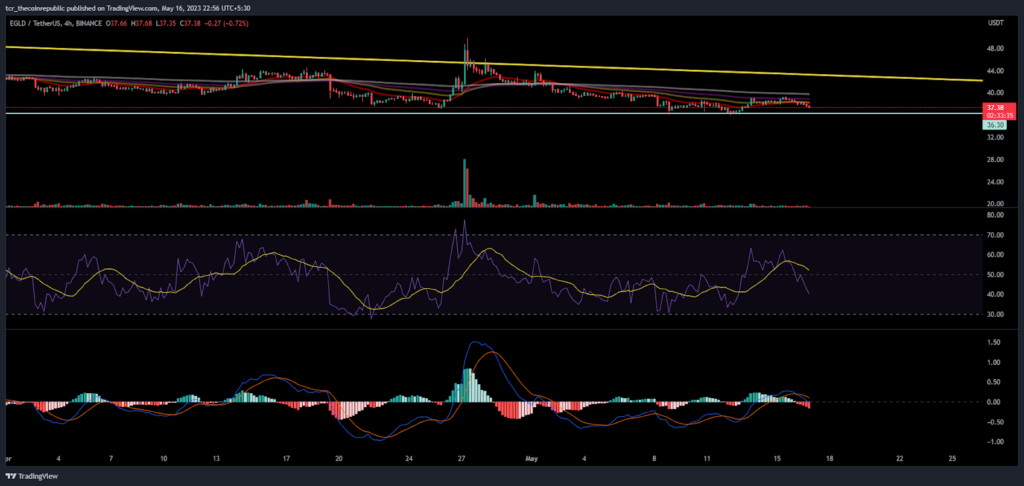
On the 4-hour charts, the EGLD token is losing the gains with rejection from the 20-day EMA. The token is below the significant moving averages, showing that sellers and buyers have gained traction and are slowly unwinding the longs.
The RSI curve is below neutrality and slipping below 50, showing a negative crossover, unable to hold the neutral marks. The MACD curve shows a bearish crossover and losing strength below the neutrality.
Conclusion:
EGLD token is losing the gains with rejection from 20-day EMA. The token is below the significant moving averages and shows that sellers gain traction
Technical Levels:
Support Levels: $30.00
Resistance Level: $40 and $45
Disclaimer
The views and opinions stated by the author, or any people named in this article, are for informational purposes only and do not establish financial, investment, or other advice. Investing in or trading crypto assets comes with a risk of financial loss.


