

- ADA coin is showing downtrend over the daily chart.
- Sellers are showing their massive muscles and leading on the front
Cardano price showed an extreme selloff in the past trading session breaking below the key trendline and mark of $0.3500. Moreover, instead of shining it goes dull and continues to fall from the past weeks. However, the chart structure was not too much bearish and suggesting a bounce in the next sessions
ADA price has corrected from the recent swing high of $0.0400 and continues to drag towards the support range. Recently, the downmove went wild and broke multiple supports The chart shows rounding bottom pattern which is a reversal pattern, but buyers does not able to goes above the neckline and faced rejection resulted in the follow on selling below the $0.3500 and the selloff headed below the $0.3000 showed intense selling.


When writing, ADA is trading at $0.2696 with an intraday gain of 3.20%, showing that the price is now at a make or break level. and bears are trying to attain further lows. Moreover, the pair of ADA/BTC is at 0.0000101 BTC and the trading volume was noted with an increase of 2.28% at $285.52 Million. Moreover, the market cap of ADA is $9.45 Billion.
The ongoing price action shows that there are clear indications of an underperformance and the coin has shown a drop of more than 40% in the last months and does not have any bullish moves. The sellers showed their presence and continued to make short positions resulting in the downturn of the coin.
Daily Chart Formation of ADA
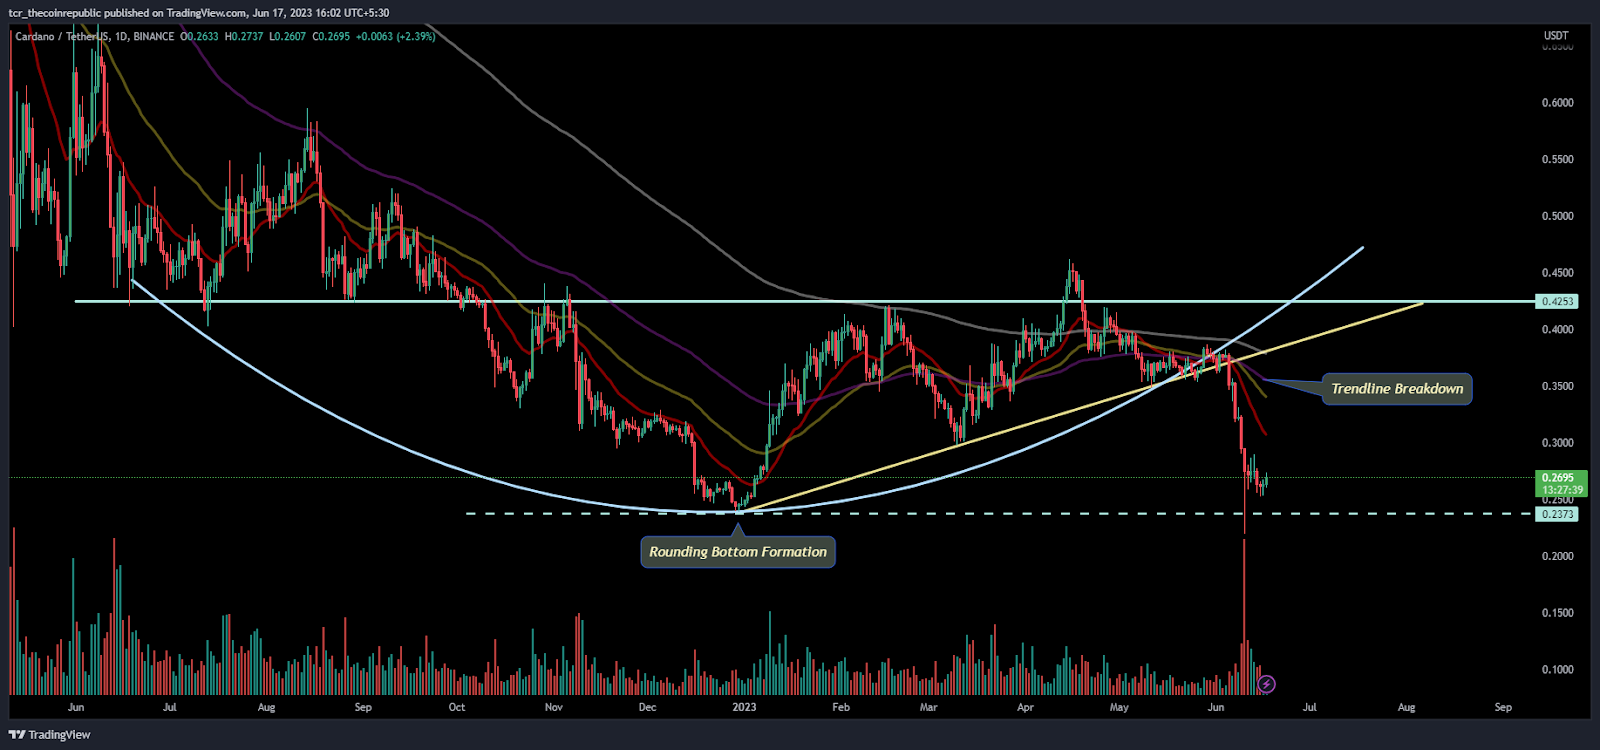
On the daily charts, the ADA coin showed a rounding bottom pattern, but the bullish reversal pattern turned into further declines and price experienced a further decline, dropping below the key mark of $0.3000.
Moreover, the price dropped below the lower Bollinger band in the last session and now showing a bounce and attained again which shows the accumulating move from the buyers.
What Technical Indicators Say?
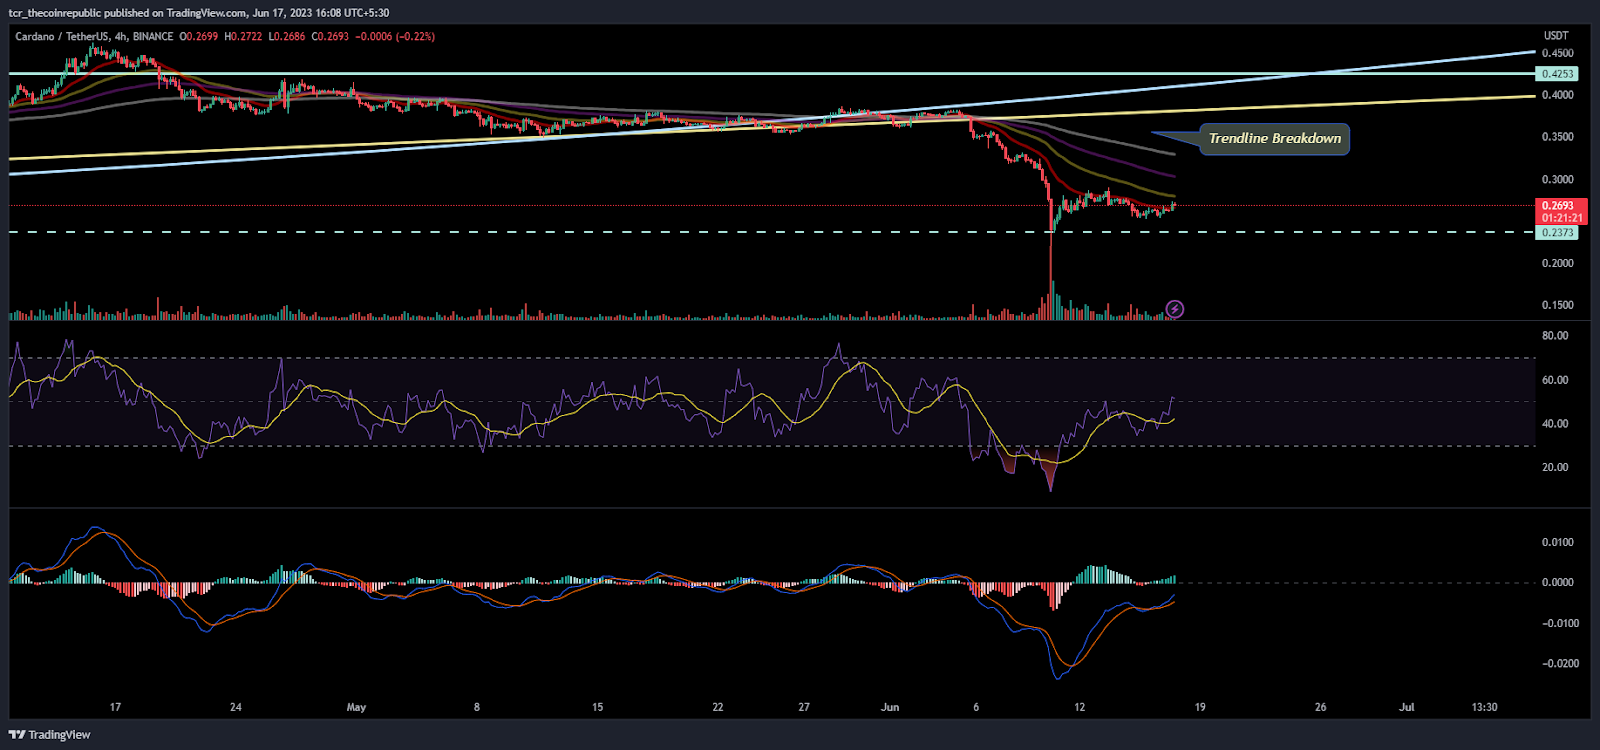
On the 4-hour charts, ADA is on the track of selling and losing the gains in the past months experiencing pressure on the top. Recently, a breakdown with volume spike shows that bears have in perfect shape, but buyers are unwinding their long positions due to fear.
The Relative Strength Index ( RSI) shows a bounce from the oversold region and is willing to gain traction again to acquire neutrality. Moreover, positive divergence was established, suggesting an upcoming bounce can occur in subsequent sessions.
The MACD curve shows an end of a corrective phase and the beginning of green bars showing buying, which signals that the reversal may start now and bulls might attain gains again.
Conclusion:
Cardano price is at a make or break level, where if further slippage happens, then there could be more downside opens, but upside is limited due to the downtrend.
Technical levels
Resistance levels: $0.3000
Support levels: $0.2500
Disclaimer
The views and opinions stated by the author, or any people named in this article, are for informational purposes only. They do not establish financial, investment, or other advice. Investing in or trading crypto assets comes with a risk of financial loss.


