

- The price of IOTA is trading at $0.18109860.
- IOTA’s market cap is $501.95 Million.
- IOTA price has been observed to decrease by -7% in the last two market sessions.
MIOTA is an Internet of Things (IoT) blockchain-based cryptocurrency and distributed ledger technology (DLT) protocol that aims to enable secure transactions and communication within the IoT ecosystem. MIOTA is based on the Tangle (Royalty-Free) technology and is a decentralized and scalable distributed agreement system (DAG). The main purpose of MIOTA is to facilitate micro-transactions and sharing of data between IoT devices, making it an ideal M2M protocol.
IOTA is Trading in Upwards Direction
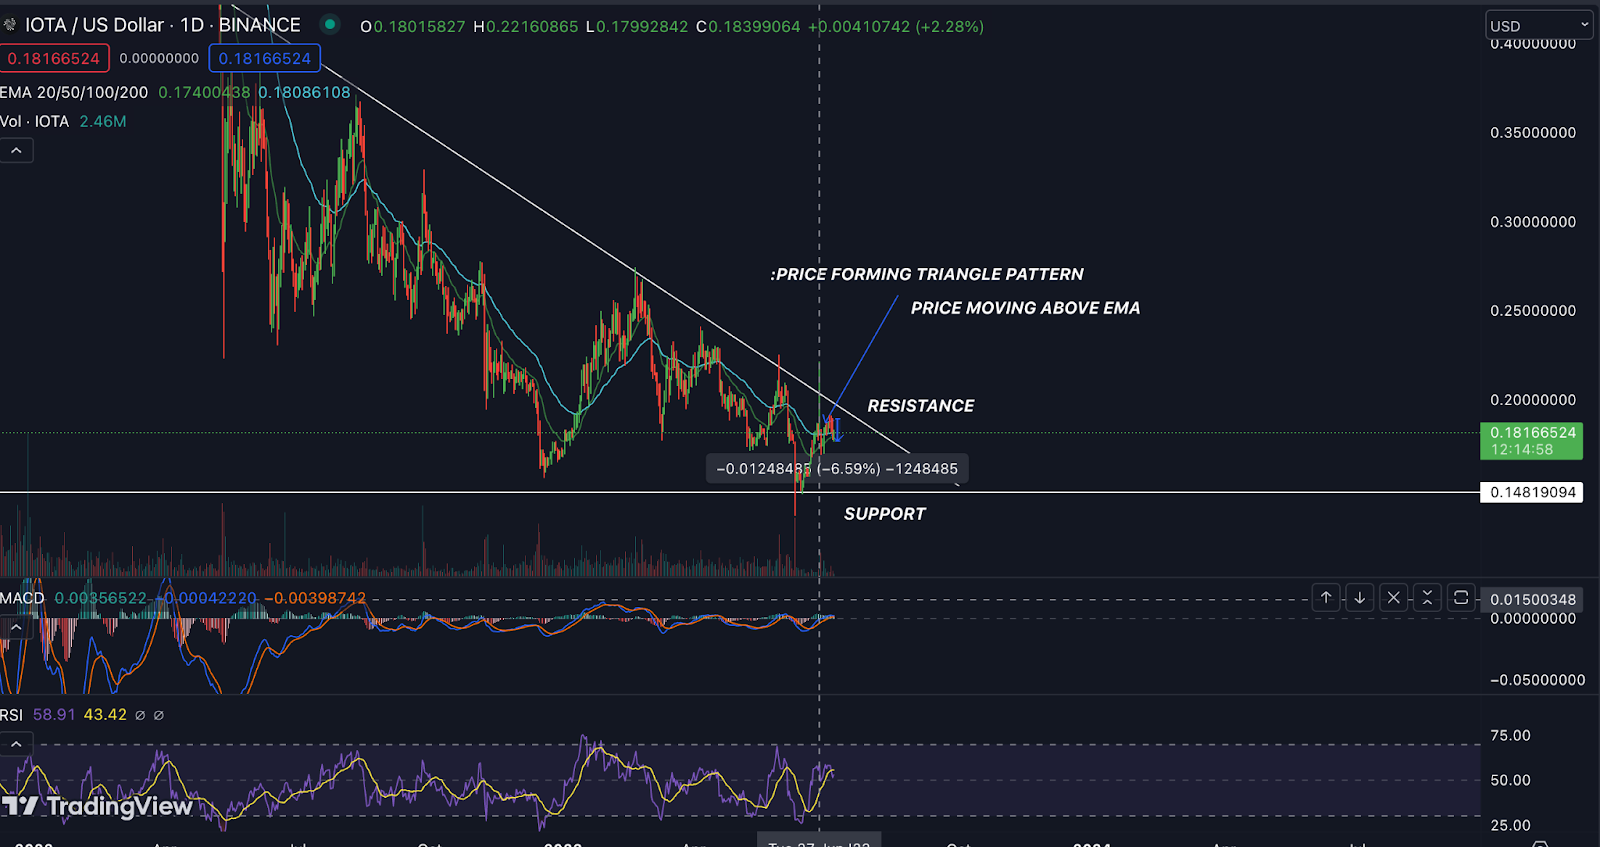
By looking at the chart in daily timeframe, it can be easily noticed that IOTA is on an upswing right now and making higher lows. The price of IOTA was falling since 2021 and fell around 92% since then. It’s also worth noting that the price has taken a turn from its important support level, which is $0.14919094. There’s a formation of triangle pattern on the chart, so if the price breaks out of that triangle, it can be expected some pretty strong momentum. Right now, the price is close to a major resistance level, so if it does break out of that, you should expect some pretty strong movement.


Technical Analysis (1D Timeframe)
IOTA Price Analysis
EMA: The IOTA coin price is currently above the exponential moving average (EMA), and there is a high probability that it will continue to increase as the EMA continues to move in the positive direction.
RSI: IOTA Relative Strength Index (RSI) is currently at 55, and the signal line is around 45, suggesting that the RSI line is above the SMA line which means the price is highly likely to dominate the level and move above it.
MACD: The MACD, also known as trend following momentum indicator, shows the relationship between the two moving averages of an asset’s price. The MACD is made up of two lines: the signal line and the MACD line. The MACD line above the signal line indicates a bullish signal, while the MACD line below the signal line indicates a bearish signal.
In the daily time frame, the MACD is currently crossing in favor of the bulls as it passes over the signal line, indicating a shift in momentum toward the bullish side. Traders may see this as a bullish indicator for IOTA coin price shortly.
Trendline Analysis:
The trendline analysis shows that the price is following the trendline, and is reversing from support, suggesting that the price will continue its upward move toward the upper end of the channel, indicating that the price is likely to rise further.
Conclusion
The analysis shows that several indicators are supportive of the bullish trend in the short term. If the price can break the above-mentioned level with enough volume, an uptrend can be anticipated. Looking at the long-term chart, the overall pattern of the IOTA coin is bullish. MACD, RSI, and EMA are all bullish indicators.
Technical Levels:
- The Nearest Support Level is $0.1481.
- The Nearest Resistance Level is $0.1972.
Disclaimer
The information provided in this article is solely for information purposes and is not intended to provide financial, investment, or any other advice. Trading or investing in crypto involves the risk of loss.


