

- Vechain’s price (VET) slid 3.49% in the last 24 hours and is currently trading at $0.017.
- Vechain Price (VET) took a rebound from the support zone and is currently trying to form a bullish flag on the daily chart.
The Vechain (VET) coin has been on a declining trend for the past 6 months losing out 39.44% of its value in the last 6 months and declining 13.01% in the past 3 months indicating dominance of sellers prevailed in the market.
Recently, the price took a rebound from the lower demand zone and tried a recovery. However, the presence of sellers at the swing high led to the failure of an attempt to shift the trend.


Thereafter, the price entered a short-term correction phase and formed a bullish flag pattern. Analysts say that the price is indecisive until it maintains itself in the channel.
Vechain (VET) is an ecosystem that uses IoT and distributed governance to solve data challenges for various industries worldwide, from health to energy, from food to sustainability, and SDG goals. It uses trustless data to create the digital backbone for the fourth industrial revolution, which requires real-time and trustless data exchange among many participants.
Vechain Price Forming Bullish Flag Pattern On The Daily Chart
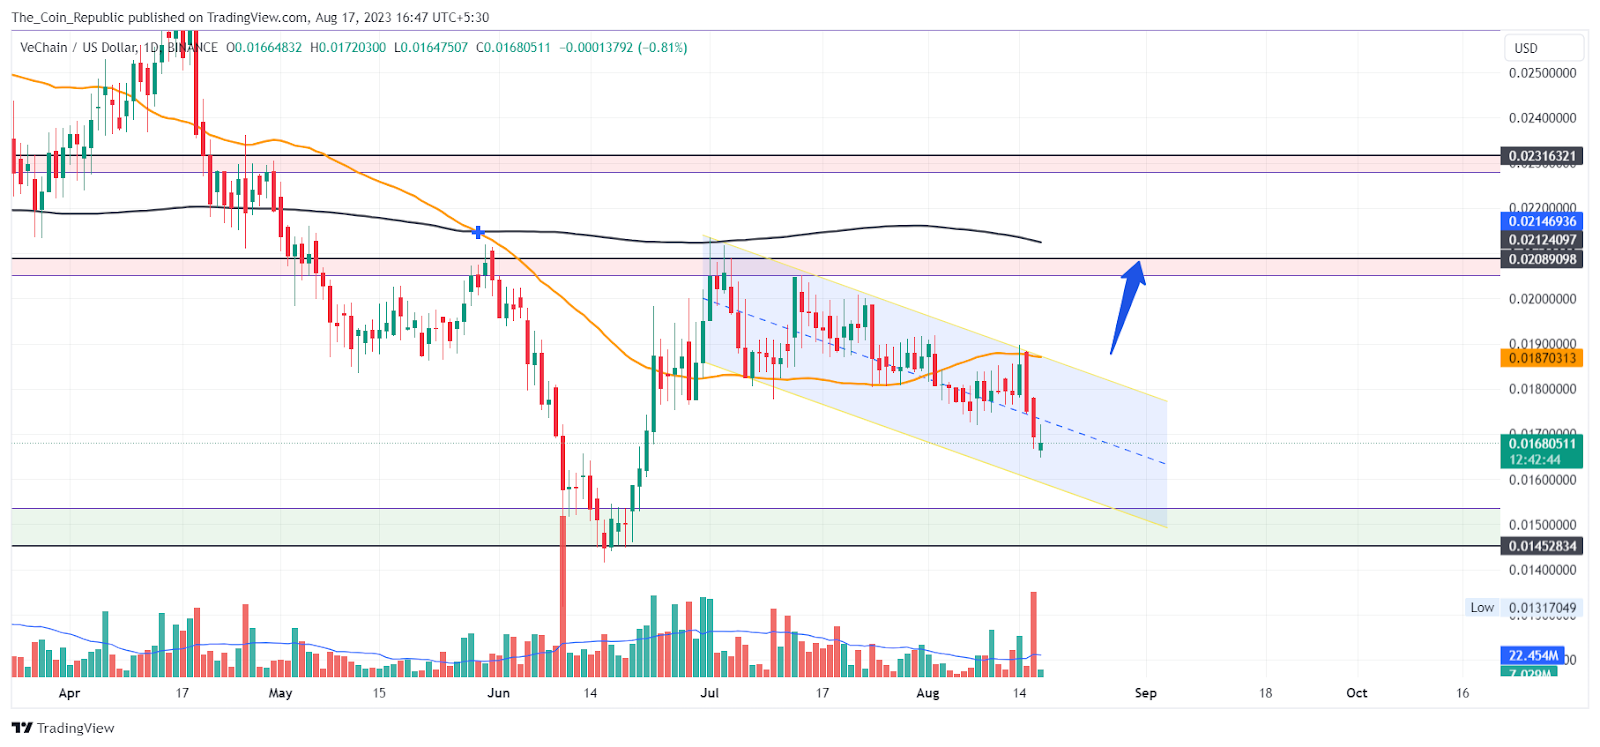
The short-term outlook for Vechain Price (VET) prediction stays neutral to the bearish side until the price stays below the bullish flag. However, the buyers may try to take over the game if the price breaks and sustains above the bullish flag.
The long-term trend is still bearish until the price remains below the previous swing high. However, the buyers have started participating in the market indicating that the price may try to turn its long-term trend to Uptrend.
VET Price Prediction From Technical Indicators Point of View.
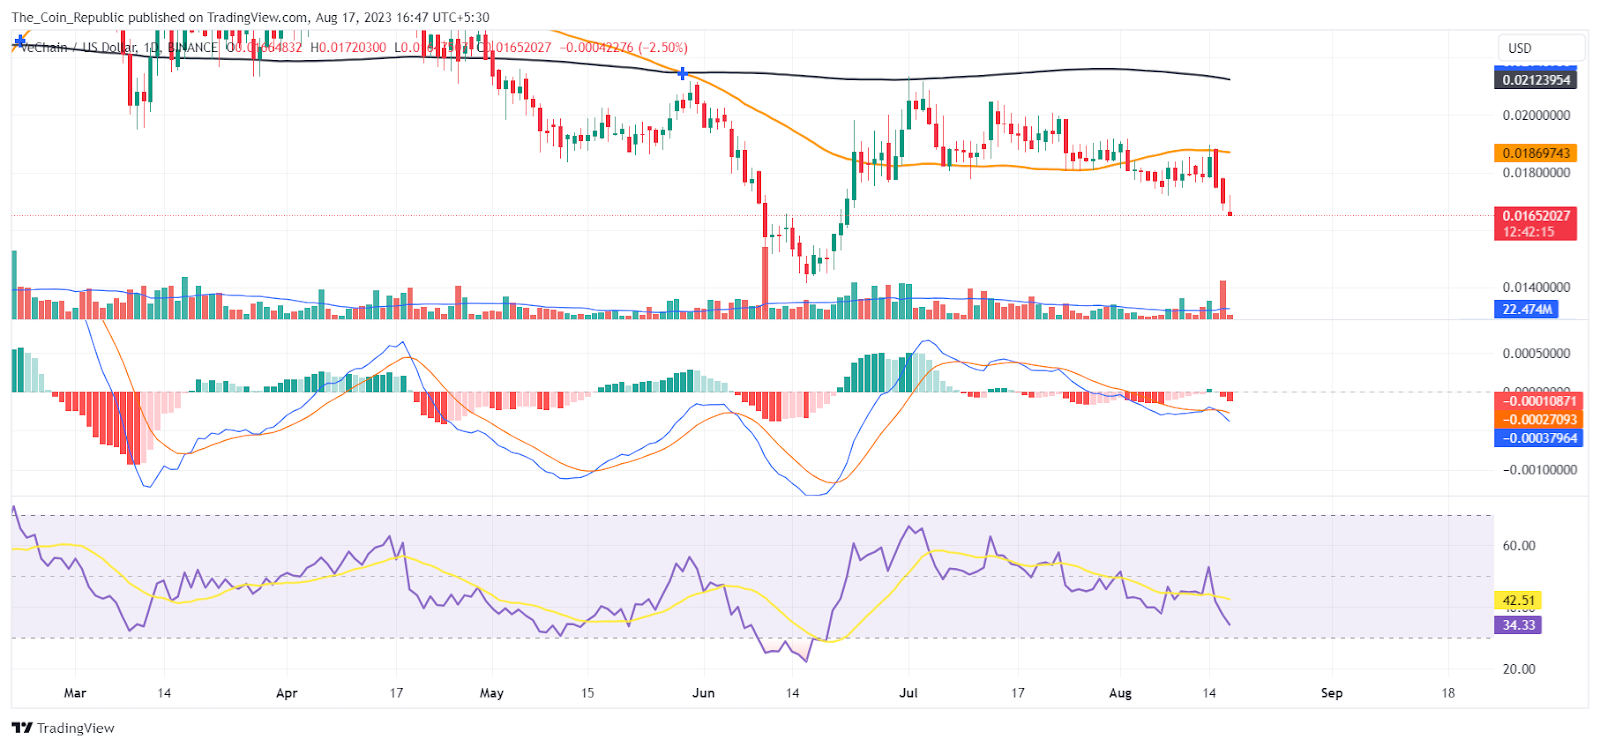
At the time of publishing, the RSI value of the VET token is 39.48 and that of the SMA line is 42.88. RSI is declining showing the short-term presence of sellers in the market. However the price is lacking momentum indicating that the buyers may step into the game.
As per the EMA analysis, the VET price could not sustain above the 50 EMA indicating the dominance of the selling pressure in the market. The price is trading below the 200 Ema which indicates weakness in the long term.
MACD lines have formed a bearish crossover. Also, histogram bars are being formed below the mean line with increasing height indicating selling pressure in the market.
Conclusion
Vechain’s price prediction concludes that the price has been falling for six months, losing 59.6% of its value. It failed to recover and faced resistance from an upper trendline. The short-term outlook is neutral to bearish unless the price breaks above the trendline. The long-term trend is bearish until the price crosses the previous low and the 200 EMA. The price may continue to fall if it breaks below the immediate support. Also, the technical indicators signal the dominance of the sellers in the market. The price may resume its long-term trend if breaks below the immediate support level.
Technical Levels
- Support levels: $0.0145 and $0.011.
- Resistance levels: $0.208 and $0.231.
Disclaimer
The views and opinions stated by the author, or any people named in this article, are for informational purposes only and do not establish financial, investment, or other advice. Investing in or trading crypto or stock comes with a risk of financial loss.


