

- JD stock price: MACD and its EMA are showing some interesting insights. Know below.
- The stock has seen a spike after touching its support level. However, the bullishness is getting dimmed.
- The JD stock price has seen a bearish trend after May 2023. Know the reason behind it.
The JD stock price started rising after the company posted its half-yearly earnings on July 22. The investors became confident as the firm’s revenue was posted with a growth of 13%.
This confidence led the bullish investors to break a major supply zone of £136. However, after the JD stock price reached the level of £213, the bears came crawling back. It led to some corrections in stock prices and the support level of £161 was broken.


One of the major blames for this sudden price correction should go to last year’s annual report. It was posted right before this downtrend started. The company reported some decline in the profit before taxes. It may have triggered a sell-off
Technical analysis and price prediction of JD stock
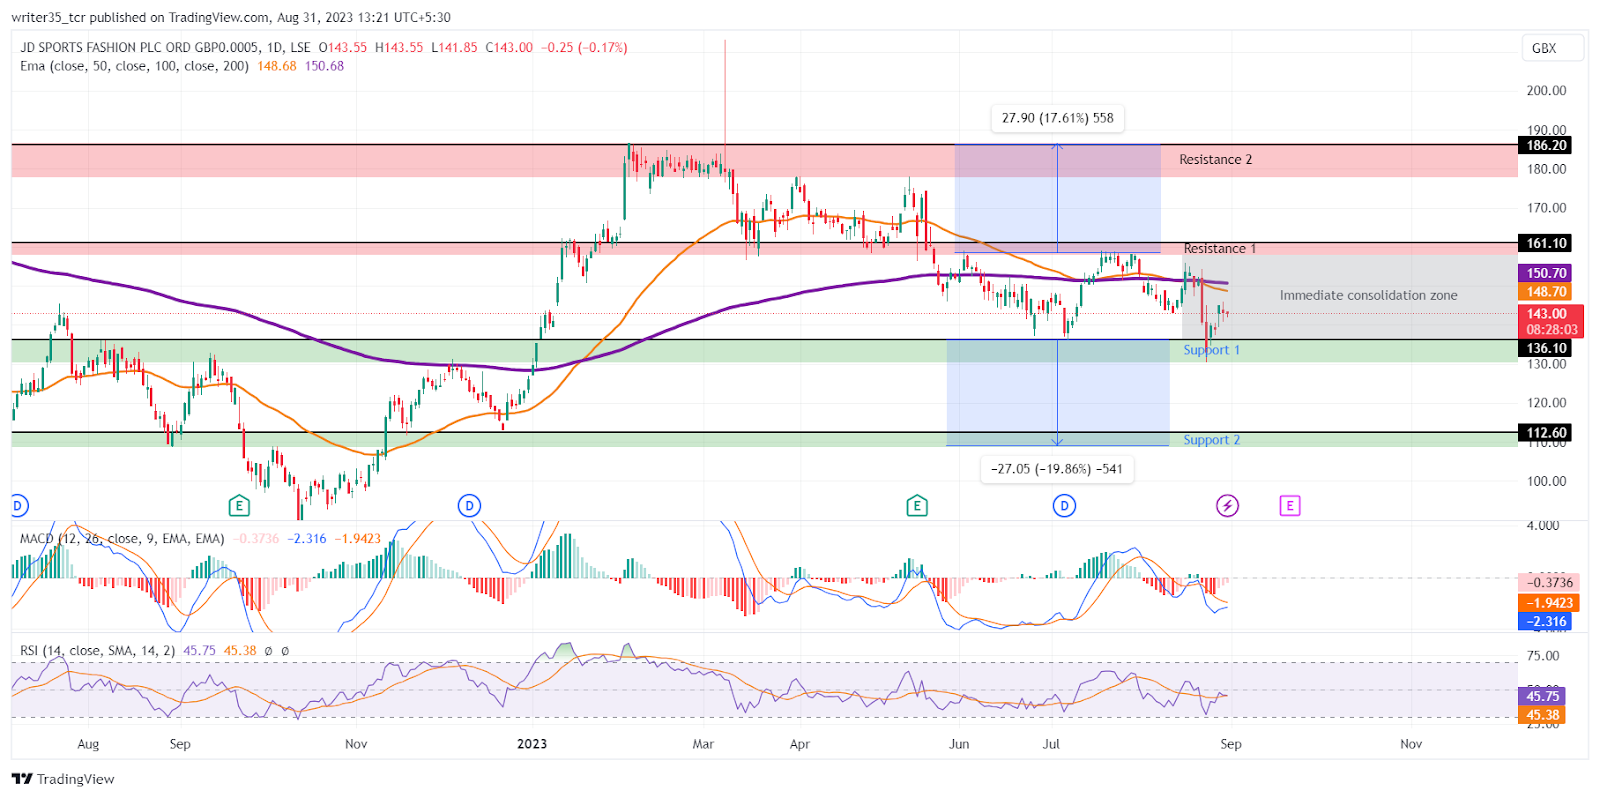
The JD stock took a hit from both of the Exponential moving averages (EMA) on 16 August. It happened when the bulls tried to push it. Currently, the stock is trading at the level of £142. The next immediate support is at the level of £136.
The Second support level for the JD stock price is the broken resistance of £112. It occurred in the bullish rally in December 2022. On the other hand, the resistances are untouched in this month. The first and immediate resistance is at the level of £161. The second resistance is 17% above, at £186.
What are the indicators showing?
Between the supports and the resistances, Indicators like MACD are showing a possibility of a trend reversal. The MACD line and its EMA did a bearish crossover back on 21 August this year. This interaction led to the current values of -2.3 for the MACD and -1.9 for its EMA. Those were closing to each other.
The RSI took a bounce from the over-sold levels of 30. The RSI line made a bearish crossover with its EMA on 21 August, the same as the MACD. At present, the RSI line and its SMA are on the same neutral territory of 45.
Furthermore, The EMAs of the JD stock prices are above the current stock price. The 50 EMA made a bearish crossover with the 200 EMA on the 16th of August. This crossover was the result of a rejection. The EMAs themselves gave that rejection to the stock price. The 50 EMA and the 100 EMA are currently at the levels of £148 and £150 respectively.
Price prediction for the JD sports stock
The price prediction for the JD sports stock is bearish if the bulls can push the price above its EMAs. Otherwise, another rejection may cause the bears to break the support level of £136. As this support level is quite strong and supported volumes, the bulls may fight back.
Technical Levels
Support: £136, £112
Resistance: £161 £186
Disclaimer
The views and opinions stated by the author, or any people named in this article, are for informational purposes only. They do not establish financial, investment, or other advice. Investing in or trading crypto assets comes with a risk of financial loss.


