
 Minter
 Quack AI
 STONK
STONK Pons
Pons Sui
Sui Pearl
Pearl Bittensor
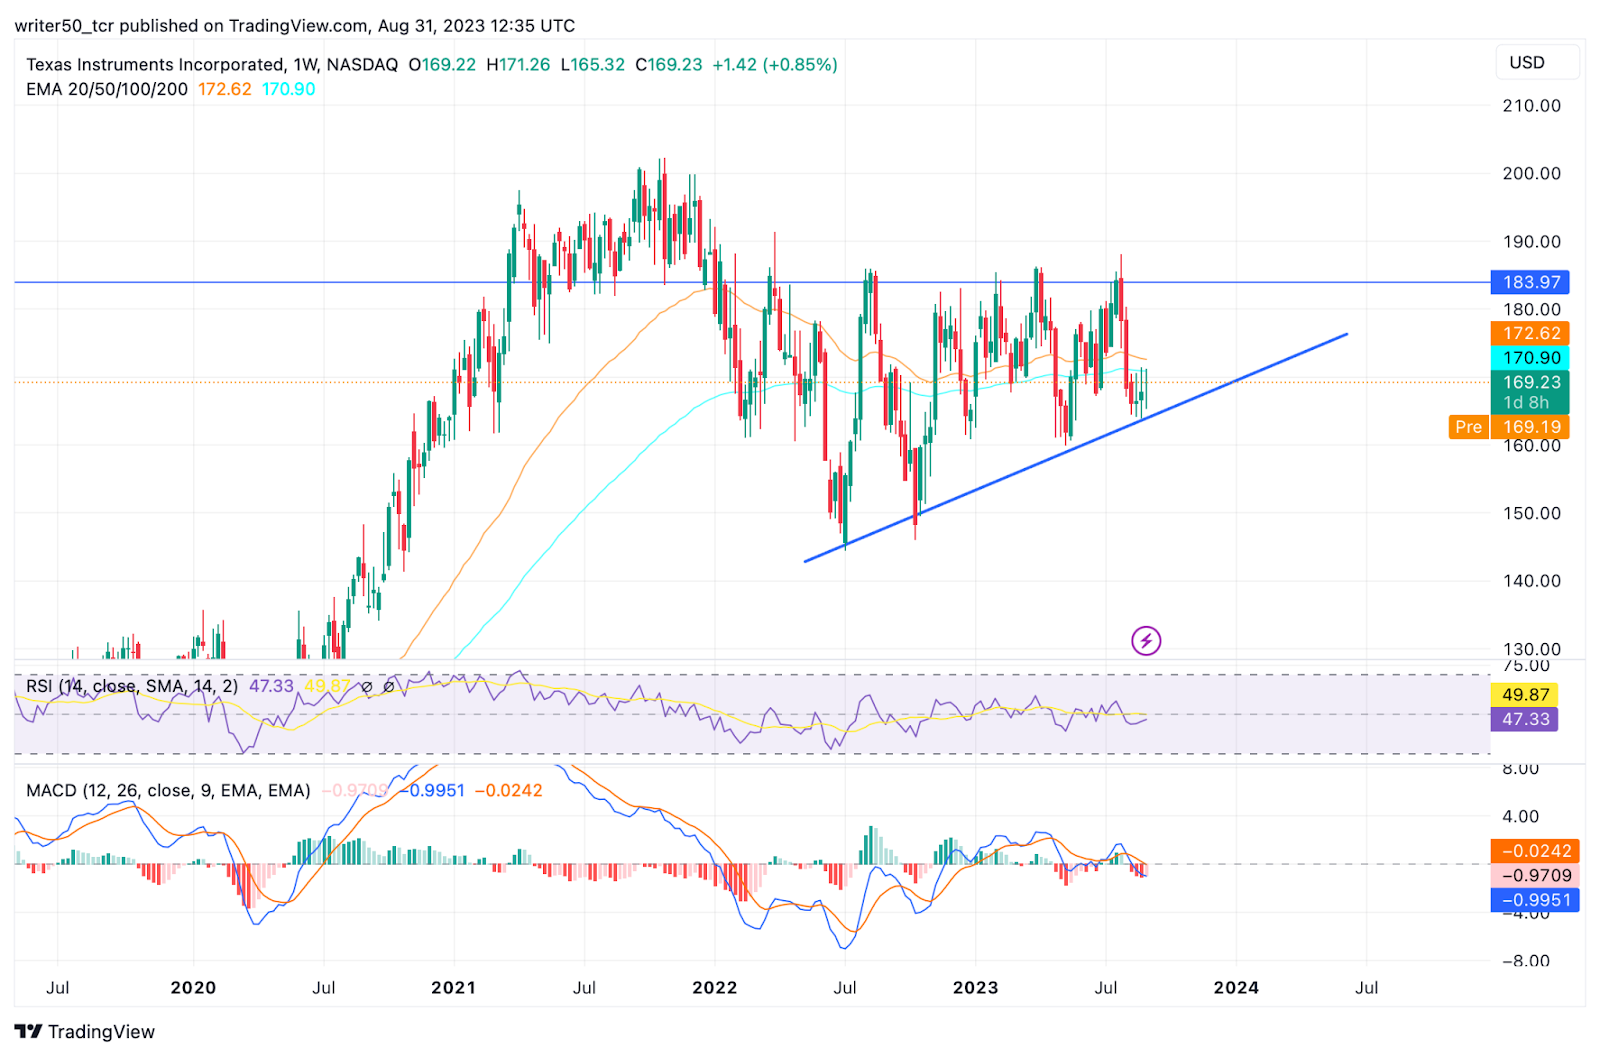
- Texas Instrument Inc.’s stock price is below the 50-day and 100-day EMA levels.
- TXN stock price is $169.23.
- Texas Instrument Inc.’s (NASDAQ: TXN)’s live market cap is $143.6 Billion.
The share price of Texas Instrument Inc. (NASDAQ: TXN) is trading in a downward direction. In the weekly time frame, the price of the stock is decreasing and the price is forming lows.
The revenue of Texas Instrument Inc.’s stock is $20.03 Billion and it has a market cap of $143.6 Billion. The stock’s beta value is 1.1. Texas Instrument Inc. (TXN) stock has a 52-week high of $188.12 and a 52-week low of $145.97.
The revenue of Texas Instrument Inc. for Q2 2023 is $4.53 Billion and the YoY change is -13.1%,
Texas Instrument Inc. (TXN) stock price reached a high of $202.26 in November 2021. Since then, the TXN price has been in a downtrend. The price fell by around 30% in the next 8 months. Currently, the TXN price is forming a negative pattern and the price is forming a weak structure.
The price of the TXN is moving in between the falling wedge pattern. The TXN stock’s overall pattern is bearish and the price may break its support and form a new all-time low.
In the last month, the price of TXN declined by 3.65%. This indicates the CAGR of stock is experiencing a negative trend.
Texas Instrument Inc. (TXN) Stock Price Analysis
EMA
Texas Instrument Inc.’s stock price trades below the 50-day and 100-day EMA levels. This shows that the TXN stock is in a downtrend and a further price decline is possible in the future.
MACD
The MACD line for the Texas Instrument Inc. stock is trading below the signal line. Also, there is a red histogram formation in the TXN stock. This suggests that the TXN stock is currently bearish and prices may fall in the next few days.
RSI
The RSI line for the TXN stock is currently trading below the 14 SMA line. Also, both the lines are trading near the 30 level. The weak RSI line for TXN stock indicates that the price will fall in the future.
Conclusion
As per the analysis, the price of Texas Instrument Inc. stock is decreasing. The price is experiencing a downward momentum with a decline of 3% in the last 1 month. The indicators are indicating a downward movement. This shows that the price of TXN is likely to experience a downtrend in the upcoming days.
Technical Levels
- Support Level: $159
- Resistance Level: $183
Disclaimer
The views and opinions of the author, or anyone named in this article, are for informational purposes only. They do not offer financial, investment, or other advice. Investing or trading crypto assets involves the risk of financial loss.




