

- MINA announces its testworld mission 2.0 testing.
- It is currently trading at $0.38 with a growth of 1.2% in the last 24 hours.
- The token is down from it’s all-time high by 96.1%.
The Testworld Mission 2.0: Protocol Performance Testing Program The program is here. The aim of this program is to support stress testing Mina Protocol with the community members, so that this new code can be included in Mina Protocol’s upcoming hard fork with a high level of confidence.
The Program assembles the skilful and professional node operators to provide the network backbone for the testnet. Upon signup, over 260 node operators from the Mina ecosystem will be selected and become Testers. Based on the operation role assigned, Testers will conduct required testing for the entire Duration of the incentivized testnet.


– NEWS SOURCE : MINAPROTOCOL.COM
It is currently trading with a surge in the trading volume by 36%. The token marked its all-time high on 01 June 2021 where a single MINA token was priced at $9.91.
- It has a current circulating supply of 971.482M MINA which is 90.28% of its total supply.
- The token has a present market cap of $376.34M.
- The 24-hour trading volume of the token is $5.59M.
SENTIMENT ANALYSIS :
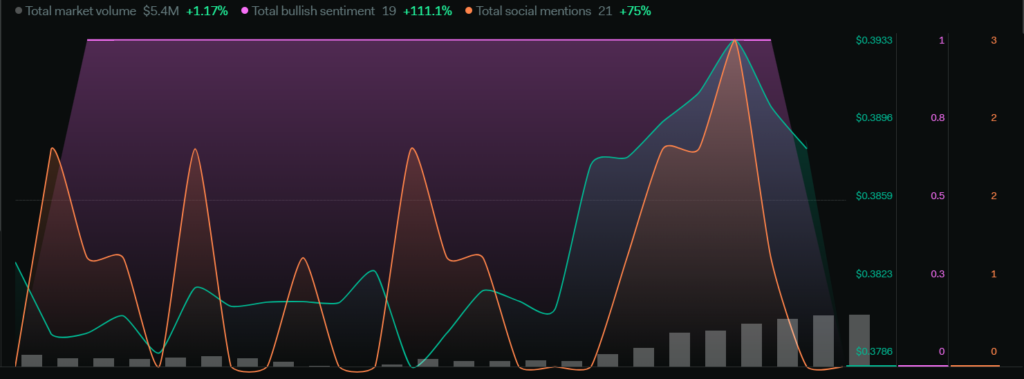
The total market volume of the token has increased by 1.17%. The total social mentions surged 75%, the total bullish sentiments have a rise of 111.1% in the last 24 hours. The overall sentiments are indicating towards a positive price action of the token.
TECHNICAL ANALYSIS :
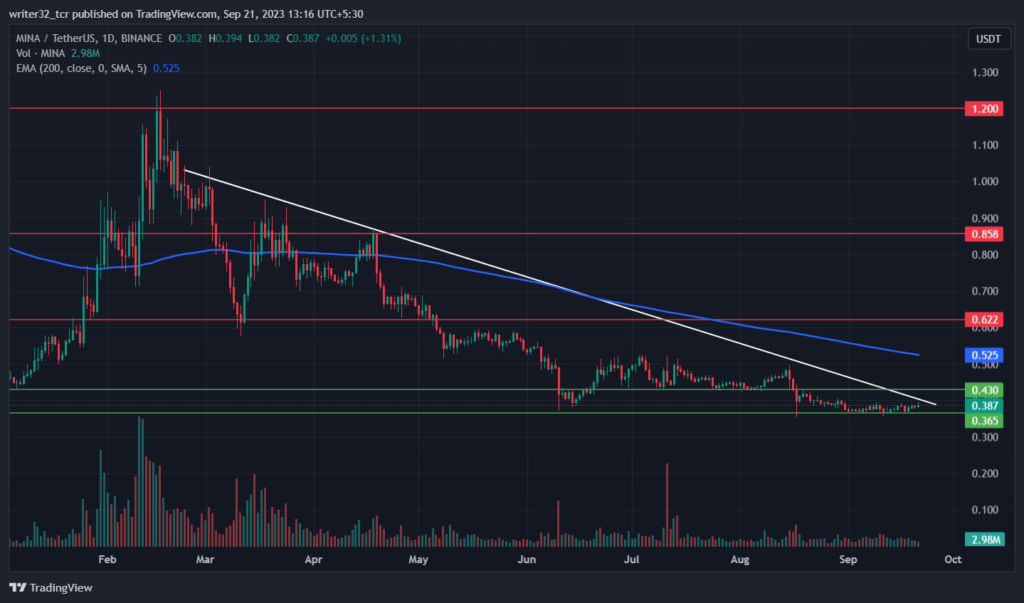
The MINA token has been significantly declining from its last high in this year of $1.2 in the second week of february. The token is currently trading at its critical support level of $0.365 from where the price is receiving a great amount of trading volume and the price can rise up from this support.
The rejection from the bearish trendline and the resistance of $0.43 which was earlier a support is currently acting as a resistance will take the price of the token to another downfall and continue the downtrend.
Also, If the price crosses above $0.43 then it will regain it as a support and also if we cross the $0.52 we will be positively bullish because we will cross the 200-day EMA.
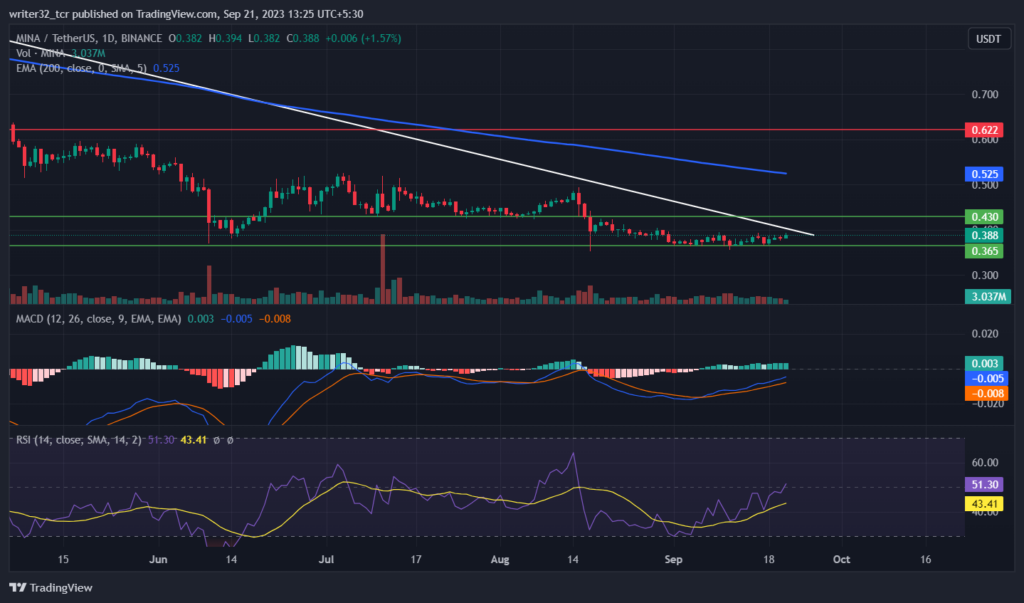
Relative Strength Index ( RSI )
The line of RSI is currently moving at 51.30 points and the SMA 14 line is moving at 43.41 points. The RSI is slightly above the neutral level 50 which indicates that there is an ongoing buying in the market of the token and the price can rise as the RSI gets increased.
Moving Average Convergence/Divergence ( MACD )
In MACD, The fast blue line moving average is above the red slow line moving average and the histogram is showing a low increase in the volume. Here, The price can rise but a low upward will be seen with this amount of volume. The volume has to increase for a good bullish move.
MINA LIVE CHART :
CONCLUSION :
The token is currently trading at a major support level and the volume of the token has also surged, The price is likely to move upwards if the market goes well. Also, If the volume decreases and we break below the support level of $0.365 we will continue the downtrend.
TECHNICAL LEVELS :
SUPPORT : $0.365 AND $0.430
RESISTANCE : $0.62, $0.85 AND $1.2
Disclaimer
The views and opinions stated by the author, or any people named in this article, are for informational purposes only and do not establish financial, investment, or other advice. Investing in or trading crypto assets comes with a risk of financial loss.


