

- The Ontology coin price has surged has up by 1.73% in the last 24 hours.
- The price is trading inside a descending triangle pattern.
ONT was launched for better privacy and security to Web3 through a decentralized identity and data solution.
Ontology (ONT) Coin: Technical Analysis
The Ontology coin’s price at the time of writing is $0.1763. It is currently trading with a 24-hour volume of $50.248 Million. The coin price has surged by 1.73% in the last 24 hours, with a market cap of $156,110,230. The coin’s circulating supply is 875,249,524 ONT coins and has a max supply of 1,000,000,000 ONT coins.


For the last 9 trading sessions, the buyers have pushed the price upward after a minor selling scenario.
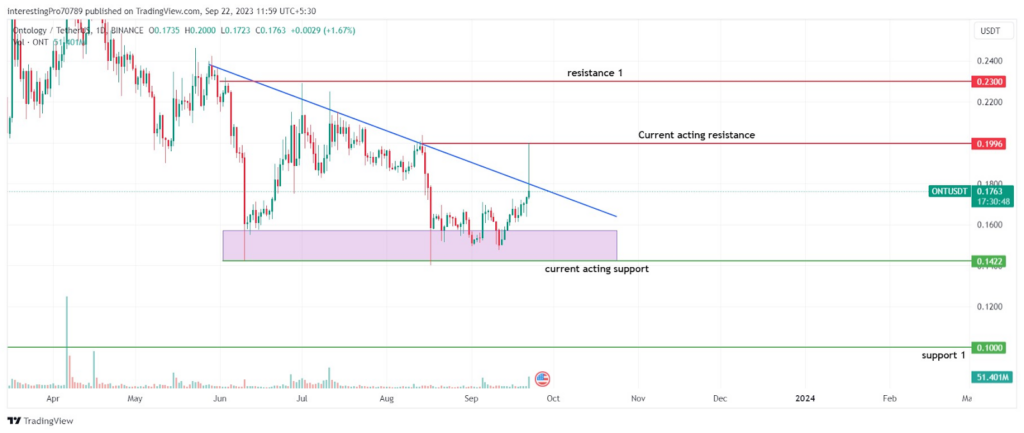
If we see the chart in a 1-day timeframe, the recent candle in forming has faced a firm rejection from the $0.1996 resistance level. It has led to forming a long wick because of the selling pressure applied by sellers over the price.
In the chart, we can also see that the price has consistently faced rejection from the trendline that is forming above. The recent candle that is forming after facing rejection from the $0.1996 resistance. It went back below the trendline. The sellers are shifting to each lower high created by the price.
At the $0.1422 support zone level, the buyer’s presence can also be seen. They push the price in the upward direction every time the price comes into that zone. It could also be seen as a descending triangle pattern, which is a bearish pattern.
If the price falls after facing rejection of the trendline and $0.1996, and breaks below the $0.1422 support zone, the price may fall to $0.1000.
However, for the token price to continue its 9-day bullish rally, it must give the breakdown of the $0.1996 resistance. Then, it may rise to its next resistance at $0.2300.
Technical Indicators About The Current Trends
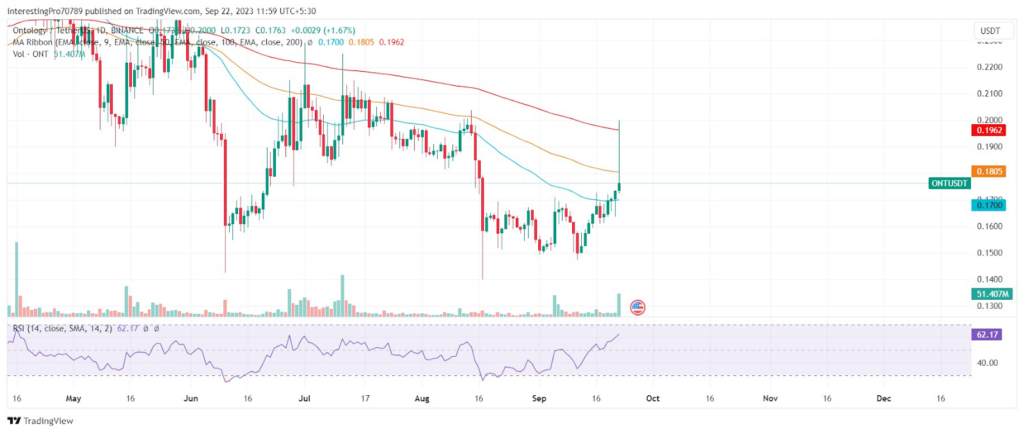
Out of three moving average lines, 100-day and 200-day EMAs point toward the selling pressure over the price. The ONT token price is facing rejection from these two EMA lines. The 50 EMA line is below the price, indicating buying pressure over the price.
The relative strength index is 62.17 and is sloping in the upward direction. It shows the price is bullish at the time of writing. The upward RSI line indicates more room for buyers at the upside.
Conclusion
The ONT coin is bearish at the time of writing. Its price has been conceding a bullish rally for the last 9 days. After reaching $0.1996, it faces rejection from the $0.1996 and forms a long wick candle. It shows the presence of sellers at that level. If the price falls after facing rejection of the trendline and $0.1996 and breaks below the $0.1422 support zone, the price could fall to $0.1000.
However, for the price to continue its 9-day bullish rally, it must give the breakdown of the $0.1996 resistance. Thus, it may rise to its next resistance at $0.2300.
Technical levels
Resistance Levels: $0.1996 and $0.2300.
Support Levels: $0.1422 and $0.1000.
Disclaimer
The views and opinions stated by the author or any other person named in this article are for informational purposes only. They do not provide financial, investment, or other advice. Investing in or trading crypto assets comes with a risk of financial loss.


