

- The AVAX coin price has given a breakout of a falling wedge pattern in the short term time period.
- The Relative strength index (RSI) indicator reflecting some bullish divergence in the nature of price momentum.
The Avalanche coin was launched on September 21 2021 by Ava Labs. The AVAX coin is a native token of the Avalanche platform. It serves as the means to distribute system rewards, participate in governance, and facilitate transactions on the network. AVAX works to secure the Avalanche blockchain and pay transaction fees across the network.
Current Market Performance of the Avalanche Coin
The coin is currently trading at $9.35 level while having a decline of 4.22% in the last 24-hours. The coin has a current trading volume of $103,915,732, which has decreased by 15.07% since the last trading session. There are 354,222,508 AVAX coins that are circulating in the market. The total market capitalization that stands at approximately $3,316,390,724.


Technical Analysis and the Price Prediction of AVAX Coin
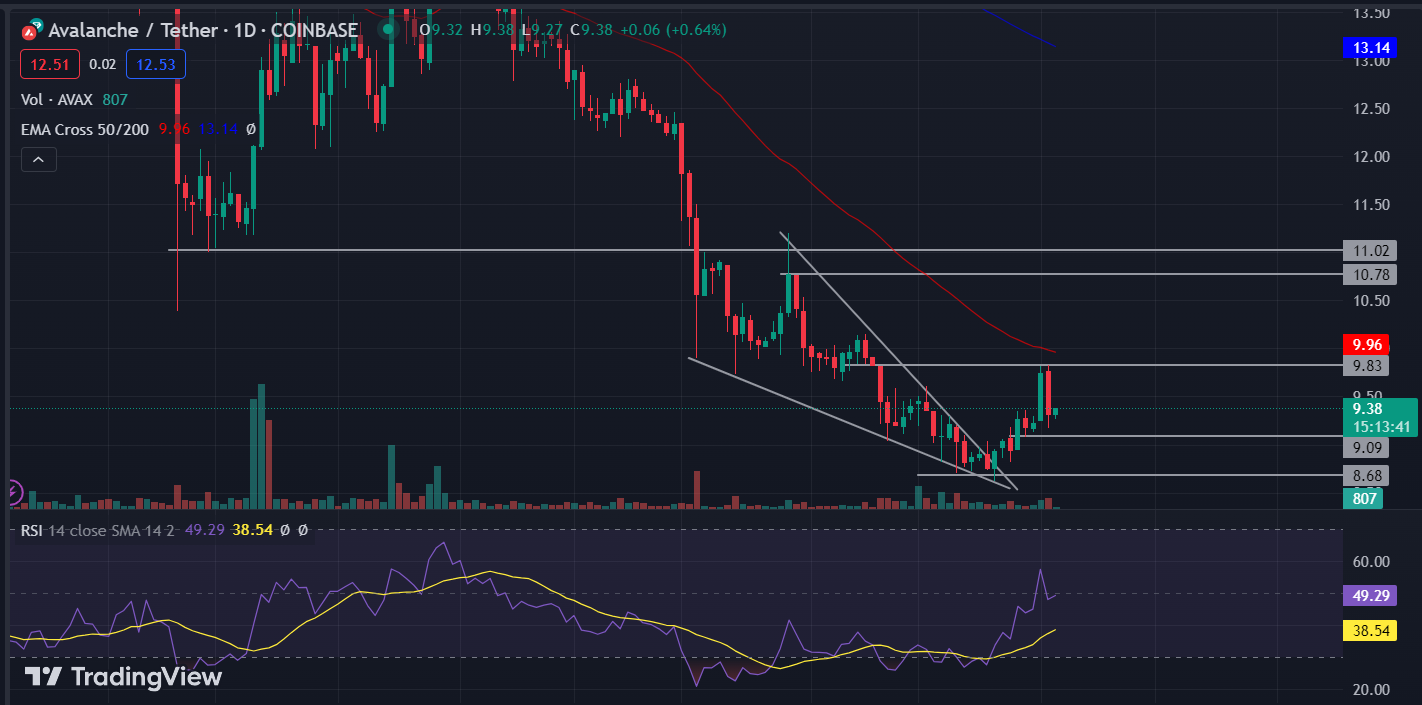
The Coin’s price is currently trading below its 50-day EMA and its 200-day EMA. On July 8 2023, the price broke above the 50-day EMA, but faced resistance from the 200-day EMA. The price is has been trading below both the EMAs. At present the price is getting rejection from the 50-day EMA at the $9.96 level. It indicates the selling pressure may take momentum over bulls.
The price gave a breakout of a falling wedge pattern in a short term time frame. At the present time, the coin price is trading at $9.38 level. In the last two trading sessions, the price formed a bearish candle at $9.83 below the supply zone. It reflects the bear’s presence at that level.
Furthermore, the relative strength index (RSI) shows a bullish divergence from the oversold region, below the 30 mark lower band. It indicates the bulls are approaching that level and the price may see a bullish momentum in the short term time period. At present the RSI is at 49.29 by having a bullish crossover with the signal line.
Conclusion
The AVAX coin’s price broke down the major support level at $11.02. It dropped up to 21.29% near the immediate support level at $8.68. After giving a breakout of the falling wedge pattern the price has started a move toward the retracement level at $11.02. So, if the price breaks above the $9.83 level, it may reach up to $10.78 to $11.02 range. For the continuation of the downtrend, it should close below $9.09 and after that it may fall to $8.68 level.
Technical Levels
- Resistance levels: $9.83 and $10.78
- Support levels: $9.09 and $8.68
Disclaimer
The views and opinions stated by the author, or any people named in this article, are for informational purposes only. They do not establish financial, investment or any other advice. Investing in or trading crypto assets may comes with the risk of financial loss.


