
 NEAR Protocol
 Bitcoin
 Puffer
 Hyperliquid
 ZKsync
 Pudgy Penguins
 Pearl
Pearl
- Bitcoin price is witnessing a death cross pattern.
- The year-to-date return of BTC price is 64.49% and the three-month return is -11.13%.
- BTC price is trading at $27219.46, with a gain of 0.95% during the intraday session.
Bitcoin (BTC) price is on the verge of witnessing a death cross pattern where the short-term 50-day EMA has crossed the long-term 200-day EMA, which signals a bearish market. Hence, it is an excellent time to buy Bitcoin. Therefore, the BTC price attracted more buyers, which led to a surge of 0.95% during the intraday session.
Moreover, the BTC price is currently trading at $27219.46, with a market capitalization of $530.48 Billion. The 24-hour trading volume is $6.31 Billion. Bitcoin has a circulating supply of 19.50 Million.
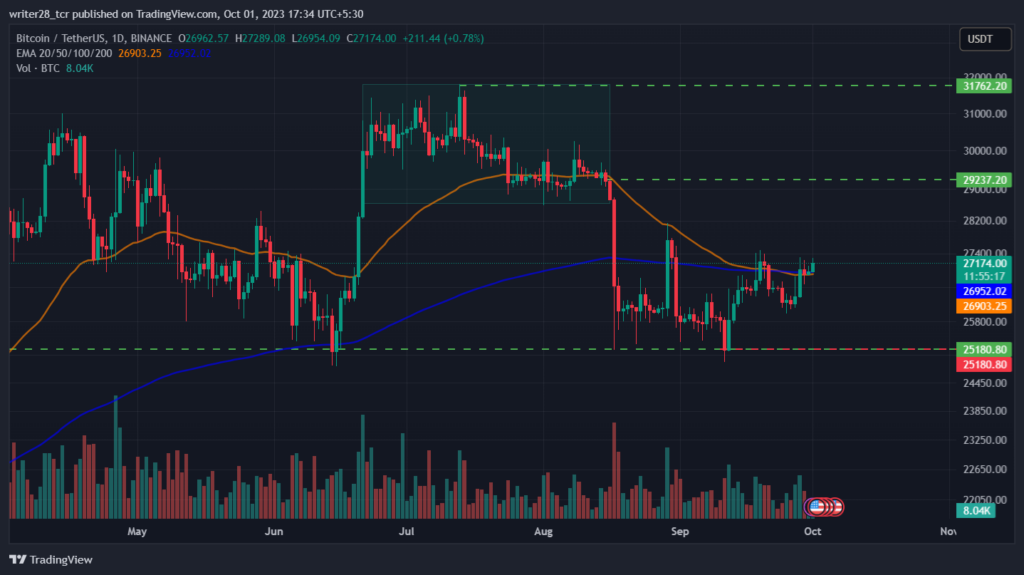
The year-to-date return of 64.49% has shown a significant hike in price in the 2023 fiscal year. However, the three-month return has shown a negative result of 11.13% which denotes that the price faced vigorous pressure from the bears. After attaining an annual high at $31804.20, the sellers’ participation increased, which caused a downward momentum.
The U.S. lawmakers are now urging the SEC and its chairperson, Gary Gensler, to allow a spot Bitcoin ETF and relieve regulations. If that happens, the cryptocurrency industry will be boosted. Moreover, the traders and investors will get a free pass to invest in Bitcoin ETFs and other crypto ETFs as well.
The press release by Altcoin Daily emphasized the bright future for Bitcoin and urged investors to focus on long-term opportunities rather than short-term price fluctuations.
Will BTC Price Retest the $30000 Mark?
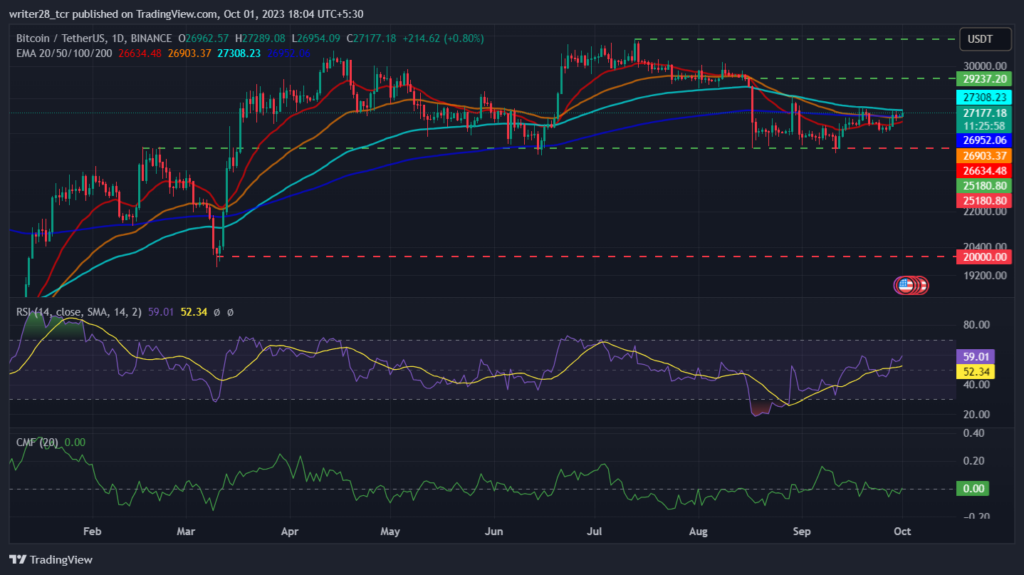
Bitcoin (BTC) price is trading above the 20, 50, and 200-day EMAs and contesting for a 100-day EMA, reflecting a death cross bearish pattern while witnessing heavy involvement of buyers in the market.
The Relative Strength Index is at 59.01, indicating bullish momentum in the market during the intraday session. However, the SMA line indicates that the price is heading towards the overbought zone.
Moreover, the CMF score stands at 0.00, denoting neither weakness nor strength in the market, and the price might consolidate.
Conclusion
Bitcoin market structure reflects that the price is heading towards $28000 while witnessing a bullish momentum in the market. Investors should look for long-term potential as the technical parameters suggest the same.
Technical Levels
Major resistance: $31000.00 and $31804.20
Major support: $19549.09 and $16499.01
Disclaimer
The views and opinions stated by the author, or any people named in this article, are for informational purposes only. They do not establish financial, investment, or other advice. Investing in or trading crypto assets comes with a risk of financial loss.




