

- In the last trading day, the price gained 0.15% after a sharp fall in price.
- Many analysts reduced their target price for the Home Depot stock.
The Home Depot Inc. (NYSE: HD) is a home improvement retail company. It sells products like building materials, home improvement products, lawn and garden products, and home decor products.
The HD stock price has been falling for the past few days under pressure caused by inflation and higher interest rates which have affected the spending on home improvement. This and many more reasons caused the analysts to reduce their target price for Home Depot.


Home Depot Inc. (HD) Stock Price Analysis
The HD stock price is trading at $292 with an intraday gain of 0.15% since the last trading day. HD stock has a market capitalization of $292.409 billion. It trades with an average 10-day trading volume of 2.735 million.
HD Stock Price Showing Bearish Sentiment in 1-Day Chart
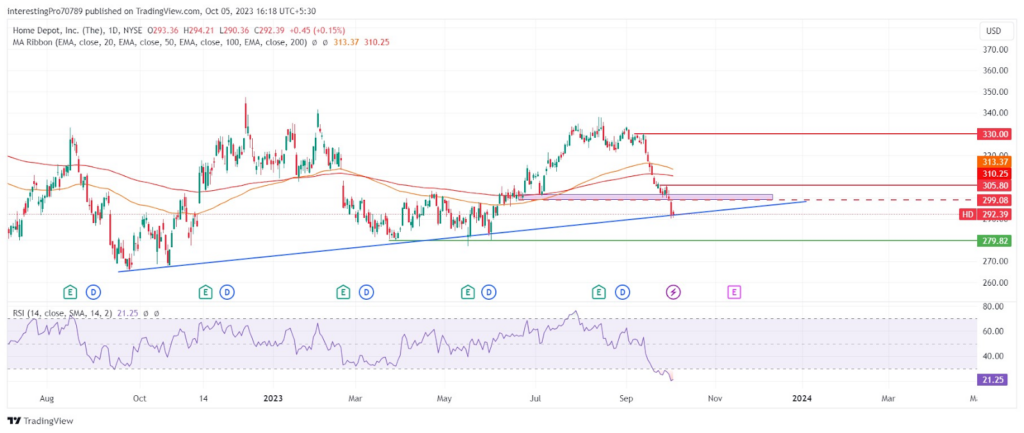
While monitoring the 1-day chart of HD, the HD stock price declined by 10.50% in the last 13 trading days. Recently, the price has given the breakdown of the $299.08 level. Currently, it is taking support from the trendline which is coming from below.
The price is trading below the EMA lines but it is far from them. The EMA lines have started to slope in the downward direction. This indicates that the price can go up to retest the EMAs despite being controlled by the sellers.
The RSI is in oversold territory, indicating that a short-term recovery or a pullback is due in the market. Thus, the price could be seen rising in the future.
Currently, the price is taking support from the trendline after the breakdown of the $299.08 level. After a sharp fall, the price can be seen in a recovery mode and could retest the $299.08 level. At the time of retesting, if the price forms a strong bearish candle, it can continue its fall to its support level at $279.82. However, the price sustaining below $305.80 would remain under the bears’ control.
However, for the price to gain bullish momentum, it must reclaim the $305.80 level and sustain above it. It may then rise to its resistance level at $330.00.
Conclusion
The HD stock price is bearish at the time of writing. The indicators are pointing towards a price recovery and the price may retest the $299.08 level. The price would still be considered as having bearish momentum as long as it is trading below $305.80. At the time of retesting, if the price forms a strong bearish candle it could fall to its support at $279.82.
The only way for the price to gain bullish momentum is if it closes above the $305.80 level and sustains above it. It may then rise to its resistance at $330.00.
Technical levels
Resistance Levels: $305.80 and $330.00.
Support Levels: $279.82.
Disclaimer
The views and opinions stated by the author or any other person named in this article are for informational purposes only. They do not provide financial, investment, or other advice. Investing in or trading comes with a risk of financial loss.


