

- Uber Technologies, Inc. stock valuation is decreasing.
- UBER stock has a share float of 1.9 Billion Shares.
- The Uber Technologies, Inc.’s annual profit margin is decreasing along with its net income.
The stock price of Uber Technologies, Inc. (NYSE: UBER) is currently moving in a downtrend. The UBER stock price has been forming a pattern of lower lows, and recently, it was in a consolidation phase.
As of the latest data, UBER is trading at $44.95, with a slight 0.9% increase today. The company has a share float of 1.9 billion shares, and its return on assets has declined by approximately -96%. The return on equity for UBER is -94%, indicating lower returns for the company.


Over the past month, Uber Technologies’ stock has experienced a -5% decrease in value. This recent loss could potentially deter prospective buyers from entering the market.
Looking back to February 2021, the UBER stock price reached a peak of $64.05, but it subsequently experienced a significant decline of nearly 69%. The stock found support at the $20.40 level, leading to a notable 145% recovery.
In the most recent four weeks, the UBER stock price has been moving within a triangle pattern. However, it has encountered resistance, resulting in a reversal. The price is currently forming a weaker structure in the shorter time frame, increasing the likelihood of a future price decline.
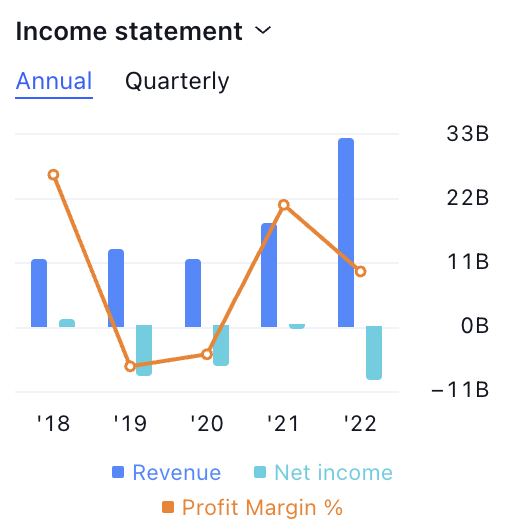
The profit margin of the stock is decreasing along with the net income. This decreasing profit margin reveals the poor performance of the company.
Uber Technologies, Inc. (UBER) Stock Price Analysis
UBER by writer50_tcr on TradingView.com
Technical Indicators Summary:
Uber Technologies, Inc. stock prices are presently situated under the 50-day and 100-day EMA levels, signifying a current downtrend and the potential for further price decline.
Furthermore, both the RSI and the 14-day SMA lines for Uber Technologies, Inc. (UBER) are approaching the 30 level, both residing in the negative territory, indicating the likelihood of future price decreases.
The volume of UBER stock is also declining. This shows that the buyers are losing interest in their position. This might become a major factor for the price fall as sellers are dominating.
Conclusion
According to the analysis, Uber Technologies, Inc. stock is showing signs of a downward move in a smaller timeframe. The stock is exhibiting a weak chart pattern along with giving negative returns in the previous month. Additionally, the indicators are displaying a weak indication for the future price. Thus, this increases the possibility for the price to see new lows in the future.
Technical Levels
- Support Level– $48.
- Resistance Level– $55.
Disclaimer
The views and opinions of the author, or anyone named in this article, are for informational purposes only. They do not offer financial, investment, or other advice. Investing or trading crypto assets involves the risk of financial loss.


