
 Dacity Coin
 Bitcoin
 Pearl
Pearl NEAR Protocol
 Quantus
 Bittensor
 Pudgy Penguins
- Cisco System is an American multinational digital communications technology company. CSCO manufactures, develops, and sells software, networking hardware, high-technology services, and telecommunications equipment.
- The company was founded by Leonard Bosack and Sandy Lerner on 10 December 1984.
Technical Analysis of CSCO
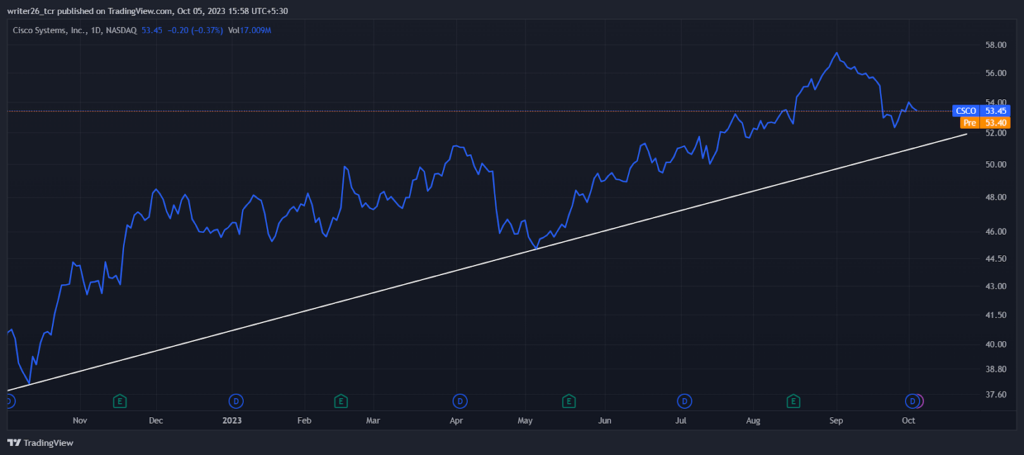
CSCO stock in 1-D time frame analysis is performing well. Since 2023, the stock has been moving in an upward direction. It is in bullish momentum because it is continuously in an uptrend position. Overall the stock is up by 66,712%, which indicates that the stock might have given good returns to its investors in the past. Near the current market price, it might fall to take another support from the trend line and might continue its upward momentum. Its all-time high value was made on 29 December 2021, which was around $60. The price may increase by 1.39% by 10 October 2023. It might reach a $54.19 price level. Greed and Fear show 39 (Fear). The price changing rate was around 2.60% over the last 30 days. This stock recorded 15/30 green days in the last 30 days.
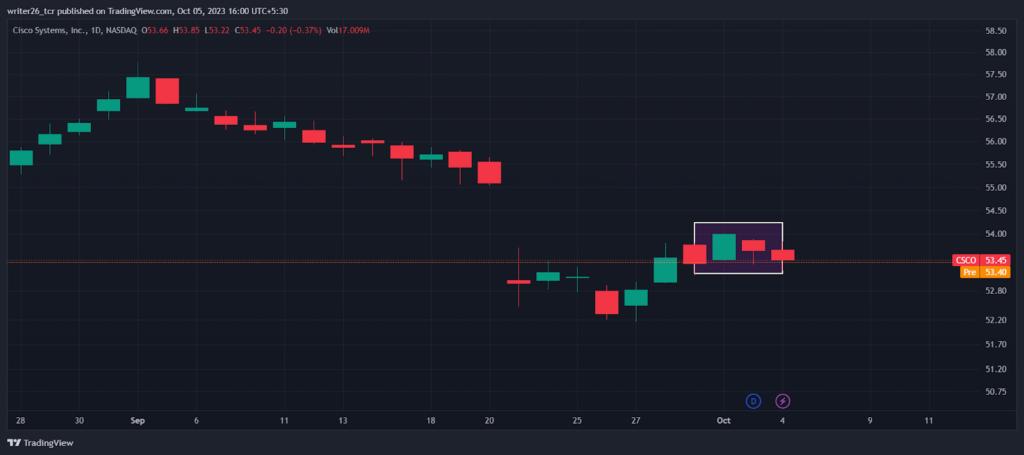
The stock might fall in the upcoming trading days after the formation of bearish patterns. On the line chart, we predicted that it might fall to take support. The Candlestick pattern confirms that it will fall in till it reaches the trend line.
Fundamental Analysis of Cisco
The Market capitalization of CSCO as of 2023 is $216.61 Billion. The current market price of CSCO on 05 October 2023 is $53.45. Its Total Revenue has been boosted in 2022 as compared to the previous year. The Total Revenue in 2022 was $56.99 Billion. Overall, the fundamentals of CSCO in 2022 performed well in comparison with the previous year. The Operating Income increased in 2022 which was $15.03 Billion. Its Net Income increased in 2022 which was $12.61 Billion.
Live Chart of CSCO
Conclusion
As per the analysis, we can say that CSCO stock is performing extremely well. It is suitable for the short-term duration because of its uptrend momentum. The analysis is done to provide technical information about the stock. It might carry its bullish momentum in the future after some retracement. In the 5-D time frame, it was up by 0.15%, and last month it was down by 6.65%. Last year, it was up by 27.29%. In 6 months, it was down by 3.15%. The stock is good for investors’ portfolios as it might provide good returns to its investors in the future.
Technical Levels
Support level- $51.55
Resistance level- $53.16
Disclaimer
This is a general article that does not provide any financial information. Investors should focus on both technical analysis as well as fundamental analysis. The analysis is done to provide information to readers. To make them aware of investments.




