

- The BCH token recorded its yearly high of $329 at the end of June.
- It is currently trading at $230 with an intraday rise of 0.31%.
- The token is down by 94.69% from its all-time high.
The BCH token outshines transactions worth $35,000,000 used in over 11,500 smart contracts. This token has a remarkable ROI of 86.42% in the last 6 months. The token is presently trading above the 200-day EMA in a bullish trend.
It is currently trading with a rise in the trading volume by 2.3% in the last 24 hours.


The token marked its all-time high on 20th Dec 2017 when it was priced at $4,355.
The present market capitalization of the token is $4.49B. It has a circulating supply of 19.52M BCH, which is 92.97% of its total supply. The 24-hour trading volume of the token is $156.28M.
BCH Coin Sentiment Analysis
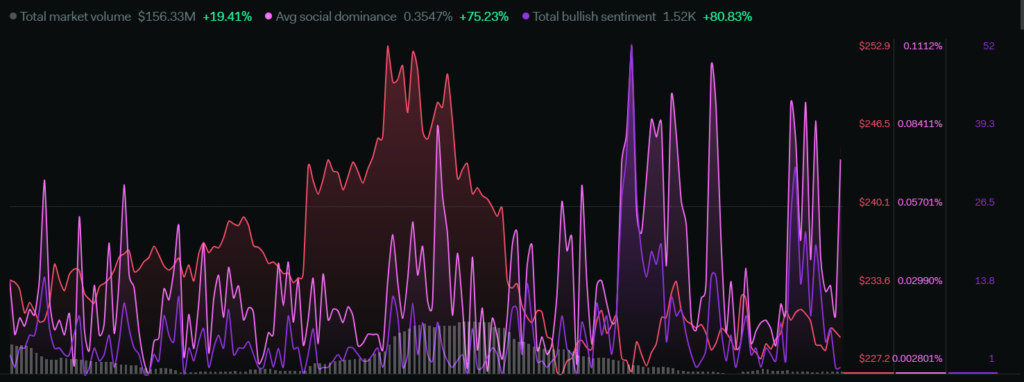
The total market volume of the token has surged by 19.41% and average social dominance has increased by 75.23% in the last 1 week. The total bullish sentiments have seen a rise of 80.83%.
Overall sentiments are indicating a bullish price action as the volume has been increasing and the social community is on the active side. The bullish sentiments are increased as the volume is significantly increasing and bulls are in action.
Technical Analysis For BCH (Daily-1D)
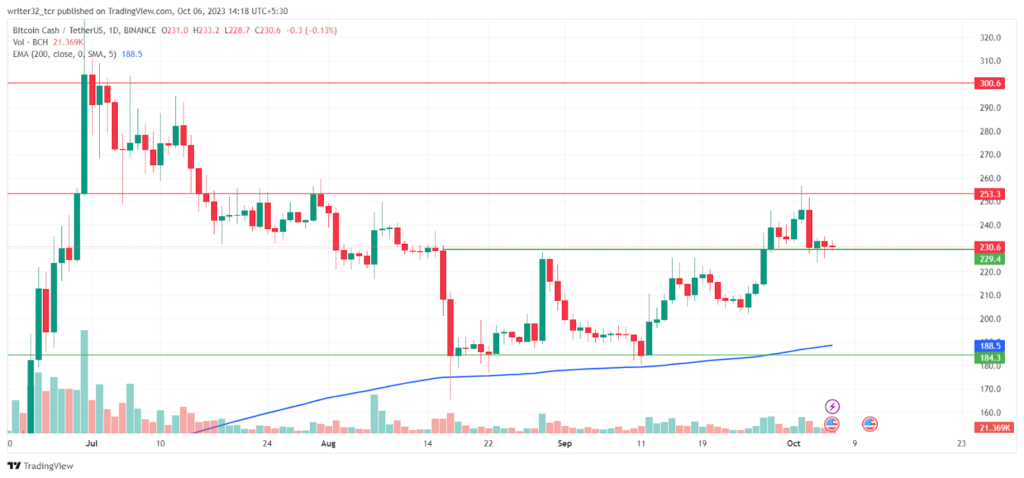
After making its yearly high the token got bearish and fell to the level of $184. From there, the price took support and tried to move upward but was rejected by the resistance of $229. In the second attempt after taking support from the $184, again the price broke the resistance and regained $229 as support. The token is presently trading at the support level of $229.
If BCH price took support from the $229 level and broke the resistance of $253, it can easily reach $300. It can further break its yearly high if the volume rises and bulls maintain their dominance.
If BCH price breaks below the support level of $229 then the price might fall again to the level of $184. Also, if the price breaks below the 200-day EMA with a short volume, the price will start a bearish trend.
Indicators on the BCH Price Trend
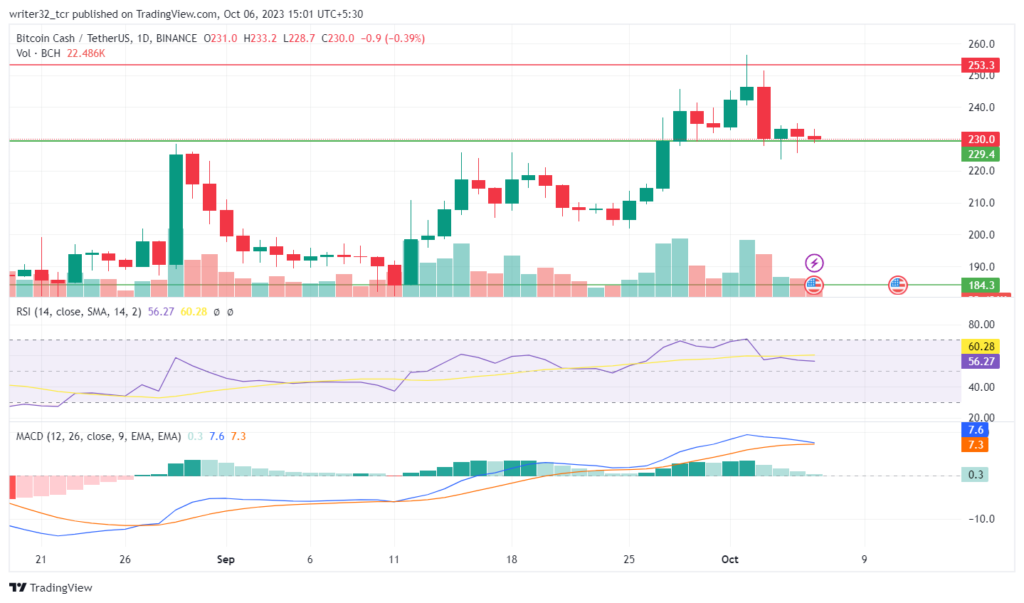
Relative Strength Index (RSI)
The RSI line is presently moving at 56.27 points and the SMA 14 is moving at 60.28 points. It is above the neutral level of 50. The RSI is currently moving below the SMA 14. If the RSI falls below the neutral level, it can be a negative sign for the price.
Moving Average Convergence/Divergence (MACD)
The fast blue line moving average is above the red slow line moving average. The histogram is showing significant falls in the volumes, which is a bearish sign for the price. If the price has to move bullish, the volume has to be significantly increased.
BCH LIVE CHART
Conclusion
If the BCH coin price takes support and breaks the resistance of $253, it can move bullish and can also cross the yearly high. In an opposite scenario, If the price breaks below the support of $229, it can fall to $184 or further if volume keeps on declining.
Technical Levels
Support: $229 and $184
Resistance: $253 and $300
Disclaimer:
The views and opinions stated by the author, or any people named in this article, are for informational purposes only and do not establish financial, investment, or other advice. Investing in or trading crypto assets comes with a risk of financial loss.


